
Findings F47 Method and statistics, Psychology and perception found 2026-10-29
More variables raise prediction skill, yet most targets stall far below their noise ceiling
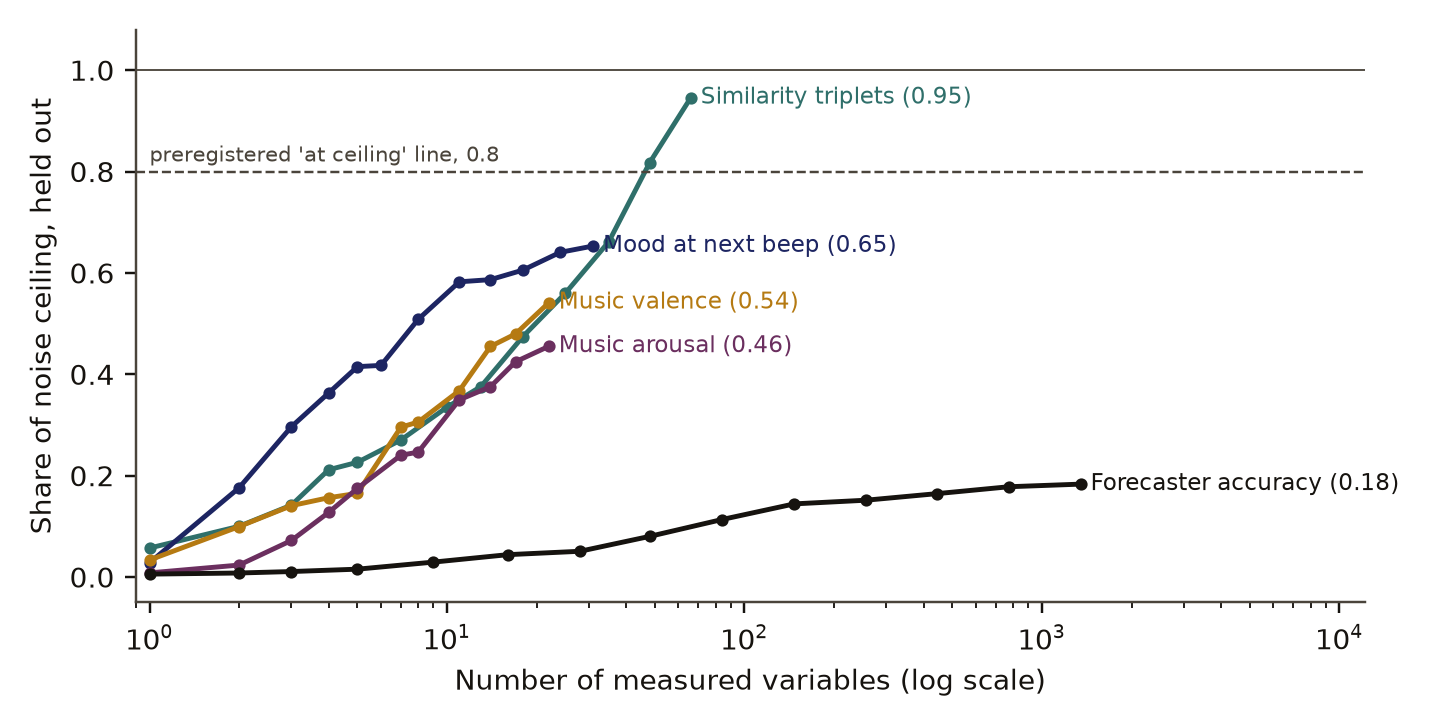
Across trees, mood, music ratings, forecasters and a similarity task, held-out skill grew as we added measured variables and always beat a shuffled baseline. In four of the five targets with a valid ceiling it stopped between 0.18 and 0.65 of the way there. We forecast that a different kind of variable would move at least three of those plateaus, and it moved one of seven.
- Tier
- B*, strong signal
- Outcome
- mixed
- Rung
- hypothesis
- Verdicts
- 2 passed, 4 failed
- Corrections
- 4, latest 2026-11-14
- Version
- v3, 2026-11-14
- Redo it
- Reproduce
Download PDF 618 KB BuildTeX source F47.bld
What this means for a reader
Adding more of the same kind of measurement helps, then stops helping long before the data's own noise would stop it. The gap closes when something different arrives, most often a record of how the same thing behaved before. If a team says it can predict an outcome once it measures enough, ask how close its current model sits to the outcome's measurement noise, and what kind of variable it has not yet measured.
Objection
Ridge and logit may leave signal that a nonlinear model finds, so a stall may be the model class; datasets are a convenience sample; DEAM rater count is assumed and the ceilings are bounds.
What would change the call. Rerun with nonlinear learners and a preregistered tree ceiling on fresh splits; leave out the private image collection; add a domain from outside our own records.
From the strongest objection recorded in our publication register.
Abstract
A common hope says that measuring enough things about a system lets you predict it. We tested that hope on public data against the best score each target's own measurement noise allows. Variables were added in random orders and the model refitted and scored on held-out cases, for six targets with a measurable ceiling: tree growth, next-beep mood, music valence and arousal ratings, forecaster accuracy and a similarity task. Held-out skill rose with added variables in every target and beat a shuffled-target control in every target. Only the similarity task, whose variables were learned from the same task, reached its ceiling (0.985 of the way); mood, valence, arousal and forecaster accuracy stopped at 0.65, 0.54, 0.46 and 0.18, and the tree ceiling estimator failed. The largest gains came from a different kind of variable: past accuracy lifted forecasters from 0.131 to 0.360 and prior growth lifted trees from 0.396 to 0.639. Both preregistered forecasts for the claim failed. Two toys with every variable known set hard limits: chaos returns forecast time only logarithmically in precision, and a published forecast that people react to can defeat itself.
c1 observed, evidence for claim 1
- Chart 1
- Held-out skill as variables are added, target by target.
- Basis
- observed: measured in this study, with a result file
- Numbers
- None in the sentence; it reads the numbers stated beside it.
c2 observed, evidence for claim 2
- The numbers in claim 2
- 0.985; 0.65; 0.54; 0.46; 0.18 matches the result file, 2026-11-09
- Chart 1
- Held-out skill as variables are added, target by target.
- Chart 2
- How much of each target's ceiling the full model reached.
- Basis
- observed: measured in this study, with a result file
c3 observed, evidence for claim 3
- The numbers in claim 3
- 0.131; 0.360; 0.396; 0.639 matches the result file, 2026-11-09
- Chart 3
- What one variable of a different kind adds to the full model.
- Basis
- observed: measured in this study, with a result file
Introduction and motivation
How predictable an outcome is, and how much of that predictability a model captures, are two separate questions. Salganik and colleagues [1] gave 160 teams a rich birth-cohort dataset and asked them to predict six life outcomes; the best predictions were only slightly better than a simple benchmark, and error depended more on which family was predicted than on the method. That study measured how far models got. It did not set the result against a ceiling from the outcome's own noise.
In neuroscience the noise ceilingDefinition: noise ceiling measurement theory and computational neuroscience The best held-out score any model could reach on a target, given how far repeated measurements of that same target disagree. It is estimated from the data's own repeats. Excludes the best score reached so far by any model, and a bound set by missing variables. full definition is routine: the best held-out score any model could reach on a target, given how far repeated measurements of that same target disagree. Lage-Castellanos and colleagues [2] compare ways to estimate it for brain responses. Hebart and colleagues [3] reported that their similarity model explained most of the explainable variance in human odd-one-out choices, against a ceiling set by repeated triplets.
For forecasters, Himmelstein, Atanasov and Budescu [5] found that psychometric traits predict future accuracy when little track record exists and that past accuracy takes over as it accumulates. That points to one kind of variable that may close a gap others leave open.
We asked whether held-out skill reaches the noise ceiling when enough measured variables are added, across unrelated domains in one design. Searches run on 9 November 2026 found the work above, and a preprint on the PISA 2022 school assessment [10] that reads predictive R2 against a ceiling set by measurement noise inside one domain. A search for a cross-domain comparison of skill curves against noise ceilings returned nothing closer; that is what the search returned, and it does not show that no such study exists. The decision this informs is where effort goes when a prediction stalls: more of the same variables, a different kind of variable, or acceptance of a hard limit.
Preregistration and design
The preregistrationDefinition: preregistration research method (metascience) A dated written plan for a study, fixed and hash-locked before any result is seen: the question, the data, the statistic, the controls, the forecasts and the kill conditions. Excludes a plan revised after looking at the outcome, and a protocol written only for the record after the run. full definition, a dated plan hash-locked before any result is seen, was written on 29 October 2026 before any model in the study was fitted to real data. Data caches were built first and printed row counts only. Several of the datasets had been used in earlier studies of ours, which the plan states so that it is not mistaken for blindness.
The plan fixed the targets, variables, splits, models, ceilings and the rule for each verdictDefinition: verdict research method (our usage) The pass or fail of one preregistered rule set against the run's numbers, read off by code. Excludes an interpretation written after reading the numbers. full definition, the pass or fail of one preregistered rule set read off by code. The predictions were:
- P1, ceiling reached: a target is at ceiling when its all-variable held-out skill above chance is at least 0.8 of its ceiling above chance. Pass if at least 4 of the 6 targets with a ceiling are at ceiling.
- P2, unmeasured variables: a target's plateau moves when its named strong variable adds at least 0.02 skill over all base variables and the result exceeds the upper 97.5th percentile of the fitted plateau. Pass if at least 3 of 7 targets move.
- P3, chaos: in the Lorenz-63 toy, the forecast horizon is linear in the log of precision (linear R2 at least 0.98), its slope is within 25 percent of theory, and the gain over the last three decades is between 0.75 and 1.33 times the gain over the first three.
- P4, reflexivity: five rules on a toy crowd, listed in Appendix A.
- P5, overfitting control: every target beats its shuffled-target control, and a deliberately overfitted fit behaves as expected (Appendix A).
The plan also held an identification test on a private image collection. That test, and the seventh P2 target built on the same collection, are left out of this paper; the P2 count below includes that target because the verdict was computed over seven.
The corrected rerun
The first run, on 29 October 2026, gave forecaster accuracy a held-out R2 of -1.686. The cause was a pipeline fault: 84 of the 1,349 forecaster variables were nearly constant among the training forecasters, so their scaled values in held-out forecasters became enormous. A second preregistration file, hashed after the first run had been read, made one change: every scaled variable is clipped to the range -5 to 5. Domains, splits, seed, models and verdict rules stayed the same. The second run is the primary result. It is a corrected rerun and not a blind one. Outside forecasters, the two runs agree within 0.01.
Data and provenance
Five public sources supply six targets with a ceiling and one without:
- Tree growth and tree death: the USDA Forest Service Forest Inventory and Analysis [8], remeasured trees in Washington and Oregon, a US government dataset. Growth is annual diameter growth of survivors from the second to the third measurement (73,553 trees); death is death between them (90,427 trees, 18.6 percent died). 42 variables measured at the second visit cover size, crown, damage, site, stand, location and species.
- Mood: openESM dataset 0062 [9], experience sampling with repeated short questionnaires (beeps) during the day, licensed CC BY 4.0. Target: rated happiness at the next beep of the same day, from 31 items at the current beep (8,141 cases).
- Music valence and arousal: DEAM static ratings [6], 1,744 clips, licensed CC BY-NC (non-commercial use with attribution); this paper reports statistics only. 22 variables: sound measures, genre flags and set flags.
- Forecaster accuracy: Good Judgment Project data [7], licensed CC0. Target: each forecaster's mean per-question z-scored Brier scoreDefinition: Brier score forecast verification (meteorology) The mean squared difference between a probability forecast and the outcome coded 0 or 1. Lower is better. Excludes measures that score only whether the most likely outcome happened. full definition, the mean squared gap between a probability forecast and the 0 or 1 outcome, on the even half of their questions (2,120 forecasters with at least 10 scored questions in each half). 1,349 individual-difference variables.
- Similarity triplets: THINGS odd-one-out choices with the 66 published object dimensions [4], used under the publisher's terms. In each triplet a person picks the image least like the other two; chance is one in three.
Methods
Curves
For each target the variables were added in 8 random orders and one informed order (by absolute training-set correlation with the target), at about 14 counts from one variable to all of them. At each count the model was refitted on training cases and scored on held-out cases. Held-out skillDefinition: held-out skill statistics and machine learning A model's score on cases kept apart from fitting: R2 for numbers, the area under the ROC curve for yes-or-no outcomes, and accuracy for triplet choices. Excludes the score on the data used to fit the model. full definition is R2 for numeric targets, AUCDefinition: AUC statistics (signal detection) The area under the ROC curve: the chance that a randomly chosen positive case is ranked above a randomly chosen negative one, with 0.5 for guessing. Excludes accuracy at any one threshold. full definition (the chance a random positive case is ranked above a random negative one) for tree death, and accuracy for triplets.
Models were ridge regressionDefinition: ridge regression statistics Least squares with a penalty on the size of the coefficients, chosen by leave-one-out error, so that many variables can be fitted without chasing noise. Excludes non-linear models such as boosted trees or neural networks. full definition with a leave-one-out penalty for numeric targets, L2 logistic regression for tree death and a conditional logit for triplets. Medians, scaling and clipping came from the training cases only. Held-out cases were whole plots for trees, each person's last 30 percent of beeps for mood, 30 percent of artists for music, 30 percent of forecasters, and between-subject repeated triplets for the similarity task.
Ceilings and shares
Each ceiling comes from the target's own repeats:
- Mood, by parallel formsDefinition: parallel forms psychometrics Two items meant to measure the same thing, answered at the same time. Their correlation estimates reliability, here happy and cheerful at the same beep. Excludes the same item repeated later, which also picks up real change. full definition: the correlation of happy with cheerful at the same beep, over 11,472 beeps. If the two items differ in what they measure, this is a lower bound, which makes the ceiling easier to reach.
- Forecasters, by split-half reliabilityDefinition: split-half reliability psychometrics The correlation between scores computed on two halves of the same items, here a forecaster's accuracy on the odd and the even questions. Excludes agreement between different people or different occasions. full definition: the correlation of accuracy on odd and even questions.
- Similarity: leave-one-out majority agreement on 1,000 repeated triplets (36,401 trials).
- Music, from rater spread, with the rater standard deviation of a clip, the number of raters and the clip's mean rating over clips:
The number of raters was not stated in the files we had; = 10 was assumed, with = 5 reported beside it.
- Tree growth: the error variance of a remeasured increment was estimated from the shrinking increments of survivors, on the assumption that true growth is never negative.
The share of ceilingDefinition: share of ceiling our usage Held-out skill above chance divided by the noise ceiling above chance. 1 means the model scores as well as the measurements allow. Excludes the raw skill, which is not comparable across targets. full definition puts targets on one scale, with the held-out skill, its chance level and the ceiling:
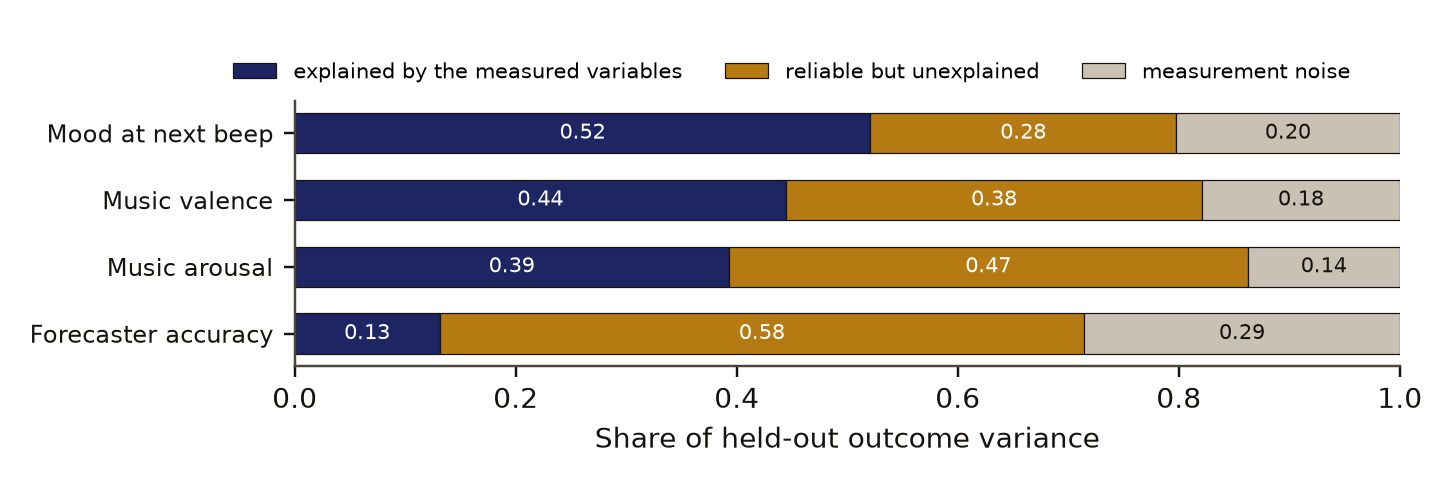
For the four numeric targets with a valid ceiling, one minus R2 splits into measurement noise, , and reliable variance the variables do not reach, .
Plateau fit
A saturating curveDefinition: saturating curve curve fitting The curve s(k) = a k / (k + h) fitted to skill above chance against the number of variables k, where a is the level it approaches. Excludes a forecast of skill with variables not in the dataset. full definition was fitted to skill above chance against the number of variables :
It was fitted to the mean random-order curve, and to each of the 8 orders separately; the spread of over the orders gives the plateau's interval. The fit bound was 2.0, and for curves that had not flattened the upper end of the interval reached it.
Strong variables
Each target had a strong variableDefinition: strong variable our usage in this study A variable of a different kind from the base set, named for each target before the run: past behaviour of the same unit, or a human rating of a related quantity. Excludes one more variable of the kind already in the base set. full definition named before the run, of a different kind from the base set: prior diameter growth for trees, the person's mean training happiness for mood, the other dimension's human rating for music, and accuracy on the other half of the questions for forecasters.
Toys with known answers
The Lorenz-63 system was run with an exact model from 100 states on its attractor, with the starting state measured with error per coordinate from to . The forecast horizonDefinition: forecast horizon dynamical systems (chaos) The time until a forecast from a slightly wrong starting state differs from the truth by more than a set tolerance. In a chaotic system it grows with the logarithm of the starting precision. Excludes errors from a wrong model, which the toy does not have. full definition is the first time the error norm exceeds 1. Theory gives the slope per tenfold gain in precision as
with = 0.906 the largest Lyapunov exponent.
The crowd toy tests a reflexive forecastDefinition: reflexive forecast economics and social science A published forecast that the forecast population reads and reacts to, so that publishing it changes the outcome it predicts. Excludes a forecast kept private from the people it describes. full definition, one that the forecast population reads and reacts to. Each of members attends when , where is the member's own taste, a fixed threshold and the published forecast of the attending share; sets how strongly members react. The forecaster measures members' tastes exactly. An unpublished forecast is never seen; a naive one is the unpublished forecast published anyway; a fixed-point forecast solves for the share that would attend given the forecast itself.
Controls and planted checks
Every target was refitted on shuffled training labels 20 times and scored on the real held-out labels. This controlDefinition: control statistics and experimental design A version of the data with the structure under test removed (for example shuffled or pooled), scored the same way as the real data, so the real score has something to beat. Excludes a comparison with a different dataset or with a published number. full definition removes the link between variables and target. The 95th percentile of those 20 draws, the top of the null distributionDefinition: null distribution statistics The spread of scores a control gives over many random draws. Its 95th percentile is the bar a real score must clear. Excludes a theoretical distribution assumed rather than drawn from the data. full definition, is the bar each real score must clear. The similarity control starts its weights at 1, so a fit that stops early keeps the raw embedding similarity, and its bar sits above chance for that reason.
The Lorenz toy is a planted checkDefinition: planted check research method; called a positive control in experimental science Data built so that the right answer is known, run through the same analysis before the real data, to show that the analysis can see the effect when it is there. Excludes any check made on the real data, which cannot show what the analysis misses. full definition for the chaos limit, since its answer is known from theory. A deliberate overfit forms a second check: 150 forecasters fitted by plain least squares with up to all 1,349 variables, which should fit the training data almost perfectly and fail held out.
The tree-growth ceiling estimator failed. It returned -3.96, because a few gross shrinkages dominate the mean of squared negative increments. It is kept as preregistered, and the tree target counts as not at ceiling.
Results
Held-out skill rose with added variables in every target and beat a shuffled-target control in every target. The highest control bar among the numeric targets was 0.013 R2; tree death's was 0.531 AUC against 0.686, and the similarity task's was 0.439 accuracy against 0.642 on its validation triplets.
held-out skill above chance (higher is better)
Similarity triplets (accuracy), chance 0.33
Mood at the next beep (R2), chance 0.00
Music valence (R2), chance 0.00
Music arousal (R2), chance 0.00
Forecaster accuracy (R2), chance 0.00
Tree growth (R2), chance 0.00
Tree death (AUC), chance 0.50
Image preference (AUC), chance 0.50
number of variables in the model, log scale
- Variables added in informed order
- Random order, mean of 8
- Shuffled target (control)
- chance
Data behind chart 1 97 rows
| Target | Variables | Informed order | Random order, mean of 8 | Shuffled target | Chance |
|---|---|---|---|---|---|
| Similarity triplets (accuracy) | 1 | 0.450 | 0.352 | 0.320 | 0.333 |
| Similarity triplets (accuracy) | 2 | 0.521 | 0.366 | 0.329 | 0.333 |
| Similarity triplets (accuracy) | 3 | 0.548 | 0.380 | 0.336 | 0.333 |
| Similarity triplets (accuracy) | 4 | 0.569 | 0.402 | 0.350 | 0.333 |
| Similarity triplets (accuracy) | 5 | 0.574 | 0.407 | 0.353 | 0.333 |
| Similarity triplets (accuracy) | 7 | 0.583 | 0.422 | 0.366 | 0.333 |
| Similarity triplets (accuracy) | 10 | 0.598 | 0.443 | 0.373 | 0.333 |
| Similarity triplets (accuracy) | 13 | 0.610 | 0.456 | 0.376 | 0.333 |
| Similarity triplets (accuracy) | 18 | 0.622 | 0.488 | 0.378 | 0.333 |
| Similarity triplets (accuracy) | 25 | 0.630 | 0.516 | 0.357 | 0.333 |
| Similarity triplets (accuracy) | 35 | 0.636 | 0.549 | 0.354 | 0.333 |
| Similarity triplets (accuracy) | 48 | 0.640 | 0.600 | 0.360 | 0.333 |
| Similarity triplets (accuracy) | 66 | 0.642 | 0.642 | 0.348 | 0.333 |
| Mood at the next beep (R2) | 1 | 0.501 | 0.023 | −0.003 | 0.000 |
| Mood at the next beep (R2) | 2 | 0.512 | 0.141 | −0.003 | 0.000 |
| Mood at the next beep (R2) | 3 | 0.516 | 0.237 | −0.003 | 0.000 |
| Mood at the next beep (R2) | 4 | 0.517 | 0.290 | −0.012 | 0.000 |
| Mood at the next beep (R2) | 5 | 0.516 | 0.331 | −0.007 | 0.000 |
| Mood at the next beep (R2) | 6 | 0.520 | 0.333 | −0.008 | 0.000 |
| Mood at the next beep (R2) | 8 | 0.520 | 0.406 | −0.009 | 0.000 |
| Mood at the next beep (R2) | 11 | 0.522 | 0.465 | −0.005 | 0.000 |
| Mood at the next beep (R2) | 14 | 0.521 | 0.468 | −0.005 | 0.000 |
| Mood at the next beep (R2) | 18 | 0.521 | 0.483 | −0.010 | 0.000 |
| Mood at the next beep (R2) | 24 | 0.521 | 0.511 | −0.011 | 0.000 |
| Mood at the next beep (R2) | 31 | 0.521 | 0.521 | −0.009 | 0.000 |
| Music valence (R2) | 1 | 0.241 | 0.028 | −0.031 | 0.000 |
| Music valence (R2) | 2 | 0.315 | 0.082 | −0.036 | 0.000 |
| Music valence (R2) | 3 | 0.348 | 0.116 | −0.069 | 0.000 |
| Music valence (R2) | 4 | 0.402 | 0.129 | −0.047 | 0.000 |
| Music valence (R2) | 5 | 0.389 | 0.136 | −0.052 | 0.000 |
| Music valence (R2) | 7 | 0.395 | 0.243 | −0.047 | 0.000 |
| Music valence (R2) | 8 | 0.396 | 0.251 | −0.047 | 0.000 |
| Music valence (R2) | 11 | 0.420 | 0.302 | −0.059 | 0.000 |
| Music valence (R2) | 14 | 0.419 | 0.374 | −0.032 | 0.000 |
| Music valence (R2) | 17 | 0.420 | 0.394 | −0.033 | 0.000 |
| Music valence (R2) | 22 | 0.445 | 0.445 | −0.022 | 0.000 |
| Music arousal (R2) | 1 | 0.211 | 0.007 | −0.000 | 0.000 |
| Music arousal (R2) | 2 | 0.280 | 0.021 | −0.000 | 0.000 |
| Music arousal (R2) | 3 | 0.254 | 0.062 | −0.001 | 0.000 |
| Music arousal (R2) | 4 | 0.324 | 0.110 | −0.001 | 0.000 |
| Music arousal (R2) | 5 | 0.324 | 0.151 | −0.000 | 0.000 |
| Music arousal (R2) | 7 | 0.321 | 0.207 | −0.000 | 0.000 |
| Music arousal (R2) | 8 | 0.320 | 0.213 | 0.001 | 0.000 |
| Music arousal (R2) | 11 | 0.336 | 0.302 | 0.000 | 0.000 |
| Music arousal (R2) | 14 | 0.340 | 0.324 | −0.000 | 0.000 |
| Music arousal (R2) | 17 | 0.357 | 0.366 | 0.005 | 0.000 |
| Music arousal (R2) | 22 | 0.393 | 0.393 | 0.004 | 0.000 |
| Forecaster accuracy (R2) | 1 | 0.040 | 0.004 | −0.003 | 0.000 |
| Forecaster accuracy (R2) | 2 | 0.069 | 0.006 | −0.003 | 0.000 |
| Forecaster accuracy (R2) | 3 | 0.066 | 0.008 | −0.001 | 0.000 |
| Forecaster accuracy (R2) | 5 | 0.073 | 0.011 | −0.000 | 0.000 |
| Forecaster accuracy (R2) | 9 | 0.081 | 0.021 | −0.001 | 0.000 |
| Forecaster accuracy (R2) | 16 | 0.088 | 0.032 | 0.000 | 0.000 |
| Forecaster accuracy (R2) | 28 | 0.097 | 0.036 | −0.000 | 0.000 |
| Forecaster accuracy (R2) | 48 | 0.105 | 0.057 | −0.000 | 0.000 |
| Forecaster accuracy (R2) | 84 | 0.099 | 0.081 | −0.002 | 0.000 |
| Forecaster accuracy (R2) | 147 | 0.118 | 0.103 | −0.001 | 0.000 |
| Forecaster accuracy (R2) | 256 | 0.125 | 0.108 | −0.002 | 0.000 |
| Forecaster accuracy (R2) | 445 | 0.132 | 0.118 | −0.002 | 0.000 |
| Forecaster accuracy (R2) | 775 | 0.137 | 0.127 | −0.003 | 0.000 |
| Forecaster accuracy (R2) | 1349 | 0.131 | 0.131 | −0.004 | 0.000 |
| Tree growth (R2) | 1 | 0.122 | 0.009 | 0.000 | 0.000 |
| Tree growth (R2) | 2 | 0.253 | 0.040 | 0.000 | 0.000 |
| Tree growth (R2) | 3 | 0.259 | 0.050 | 0.000 | 0.000 |
| Tree growth (R2) | 4 | 0.290 | 0.064 | −0.000 | 0.000 |
| Tree growth (R2) | 6 | 0.317 | 0.090 | −0.000 | 0.000 |
| Tree growth (R2) | 7 | 0.326 | 0.104 | 0.000 | 0.000 |
| Tree growth (R2) | 10 | 0.338 | 0.122 | 0.001 | 0.000 |
| Tree growth (R2) | 13 | 0.344 | 0.171 | 0.001 | 0.000 |
| Tree growth (R2) | 18 | 0.357 | 0.256 | 0.001 | 0.000 |
| Tree growth (R2) | 24 | 0.383 | 0.309 | 0.002 | 0.000 |
| Tree growth (R2) | 32 | 0.391 | 0.353 | 0.004 | 0.000 |
| Tree growth (R2) | 42 | 0.396 | 0.396 | 0.006 | 0.000 |
| Tree death (AUC) | 1 | 0.624 | 0.541 | 0.473 | 0.500 |
| Tree death (AUC) | 2 | 0.648 | 0.558 | 0.546 | 0.500 |
| Tree death (AUC) | 3 | 0.649 | 0.564 | 0.531 | 0.500 |
| Tree death (AUC) | 4 | 0.657 | 0.590 | 0.533 | 0.500 |
| Tree death (AUC) | 6 | 0.661 | 0.602 | 0.539 | 0.500 |
| Tree death (AUC) | 7 | 0.665 | 0.609 | 0.542 | 0.500 |
| Tree death (AUC) | 10 | 0.672 | 0.619 | 0.543 | 0.500 |
| Tree death (AUC) | 13 | 0.679 | 0.634 | 0.546 | 0.500 |
| Tree death (AUC) | 18 | 0.683 | 0.642 | 0.544 | 0.500 |
| Tree death (AUC) | 24 | 0.684 | 0.652 | 0.518 | 0.500 |
| Tree death (AUC) | 32 | 0.687 | 0.672 | 0.502 | 0.500 |
| Tree death (AUC) | 42 | 0.686 | 0.686 | 0.483 | 0.500 |
| Image preference (AUC) | 1 | 0.552 | 0.503 | 0.442 | 0.500 |
| Image preference (AUC) | 2 | 0.547 | 0.527 | 0.439 | 0.500 |
| Image preference (AUC) | 3 | 0.548 | 0.549 | 0.439 | 0.500 |
| Image preference (AUC) | 4 | 0.559 | 0.559 | 0.435 | 0.500 |
| Image preference (AUC) | 6 | 0.579 | 0.568 | 0.466 | 0.500 |
| Image preference (AUC) | 7 | 0.597 | 0.571 | 0.468 | 0.500 |
| Image preference (AUC) | 10 | 0.608 | 0.595 | 0.454 | 0.500 |
| Image preference (AUC) | 13 | 0.610 | 0.614 | 0.444 | 0.500 |
| Image preference (AUC) | 18 | 0.616 | 0.641 | 0.457 | 0.500 |
| Image preference (AUC) | 24 | 0.619 | 0.633 | 0.439 | 0.500 |
| Image preference (AUC) | 32 | 0.630 | 0.651 | 0.421 | 0.500 |
| Image preference (AUC) | 42 | 0.699 | 0.699 | 0.452 | 0.500 |
Read from result.json (second run), run 20261029T175624Z. SHA-256 of the run's file 647459dee912cbd1b40821fdfef1870481369fd248e04d953b6b0d1163cb49e5 and of the published copy af03b038e44458e40cf59ffd2388813fa6c9132d66a6a20092333a4c0b03ac5a. In the copy, file paths are cut to the file name and the layout (indentation, line endings) may differ; every value is the same.
Table 1 and Figure 1 give the curves against their ceilings. Shares follow eq. 2; the music ceilings assume 10 raters; the last column is the shuffled control's 95th percentile. Only the similarity task, whose variables were learned from the same task, reached its ceiling (0.985 of the way); mood, valence, arousal and forecaster accuracy stopped at 0.65, 0.54, 0.46 and 0.18, and the tree ceiling estimator failed.
For mood, the first informed variable, current happiness, gives 0.501 of the 0.521. For forecasters the curve has flattened: the plateau fit gives 0.137 with interval 0.118 to 0.155, far below the ceiling of 0.714. With 5 raters assumed instead of 10, the music ceilings fall to 0.642 for valence and 0.725 for arousal, so the music shares depend on a count we do not have.
Figure 2 shows where the variance left after the full model sits. Outside the similarity task, the larger part is reliable signal that the measured variables do not reach, not noise.
The largest gains came from a different kind of variable: past accuracy lifted forecasters from 0.131 to 0.360 and prior growth lifted trees from 0.396 to 0.639. The other dimension's rating added 0.082 to valence and 0.092 to arousal; mood's training mean added 0.032 and tree death's prior growth 0.015 AUC. Only forecasters moved by the P2 rule. For trees the gain was 0.243, but the plateau interval for tree growth ran to the fit bound of 2.0, so the rule could not pass; the preregistration's addendum records that defect and keeps the rule.
held-out skill, R2 or AUC as the row says (higher is better)
- all ordinary variables
- plus one variable of a different kind
Data behind chart 3 7 rows
| Target | Added variable | All ordinary variables | With the added variable | Gain | Added variable alone | Plateau interval, upper end | Moved by the rule |
|---|---|---|---|---|---|---|---|
| Tree growth (R2) | prior diameter growth (t0 to t1) | 0.396 | 0.639 | +0.243 | 0.606 | 2.000 | no |
| Forecaster accuracy (R2) | accuracy on the other half of the questions | 0.131 | 0.360 | +0.229 | 0.513 | 0.155 | yes |
| Image preference (AUC) | 64 principal components of the SigLIP image embedding | 0.699 | 0.844 | +0.145 | 0.836 | 2.213 | no |
| Music arousal (R2) | rated valence (human) | 0.393 | 0.484 | +0.092 | 0.386 | 2.000 | no |
| Music valence (R2) | rated arousal (human) | 0.445 | 0.527 | +0.082 | 0.378 | 2.000 | no |
| Mood at the next beep (R2) | person's mean happiness in the training weeks | 0.521 | 0.553 | +0.032 | 0.414 | 1.167 | no |
| Tree death (AUC) | prior diameter growth (t0 to t1) | 0.686 | 0.702 | +0.015 | 0.658 | 0.789 | no |
Read from result.json (second run), run 20261029T175624Z. SHA-256 of the run's file 647459dee912cbd1b40821fdfef1870481369fd248e04d953b6b0d1163cb49e5 and of the published copy af03b038e44458e40cf59ffd2388813fa6c9132d66a6a20092333a4c0b03ac5a. In the copy, file paths are cut to the file name and the layout (indentation, line endings) may differ; every value is the same.
One of six targets reached 0.8 of its ceiling, against a forecast of at least four, and one of seven plateaus moved, against a forecast of at least three. Both are honest nullsDefinition: honest null research method (our usage) A working test that found no effect beyond a stated bound, a forecast that failed, or an error of our own found and fixed, reported with the same weight as a positive result. Excludes a void run, and a result left unpublished because it was negative. full definition of the claim's forecasts, reported with the same weight as the passes.
c4 observed, evidence for claim 4
- The numbers in claim 4
- 0.8 matches the result file, 2026-11-09
- Chart 2
- How much of each target's ceiling the full model reached.
- Chart 3
- What one variable of a different kind adds to the full model.
- Basis
- observed: measured in this study, with a result file
The toys
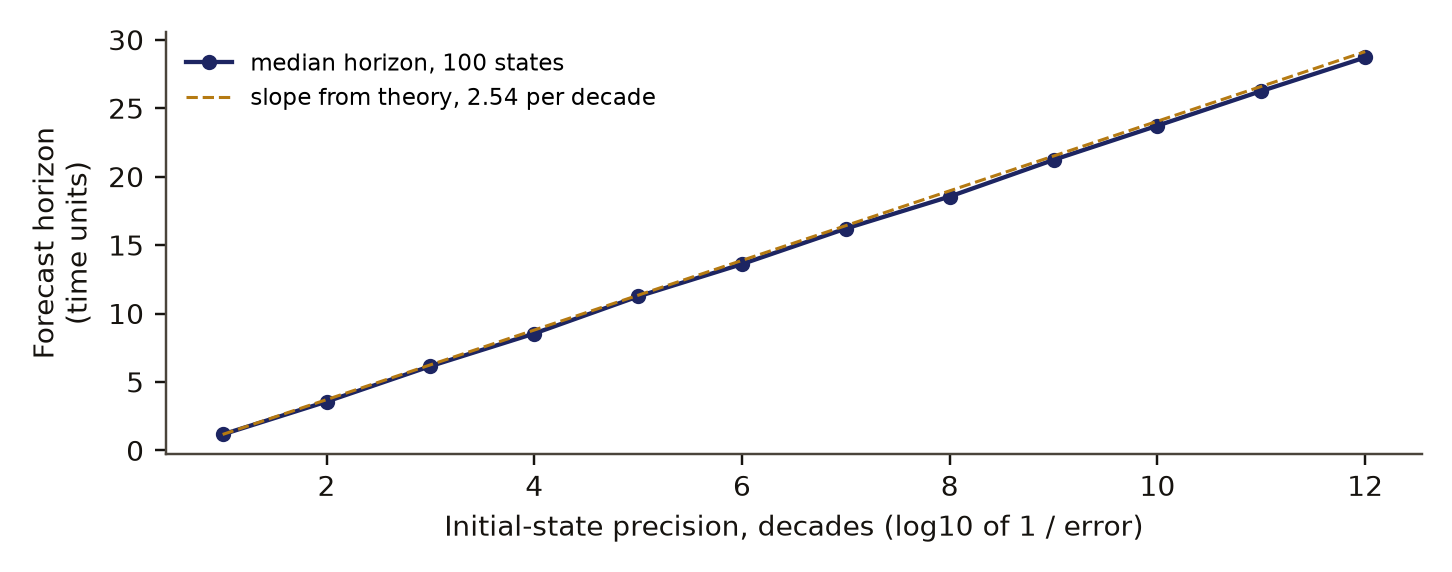
In the Lorenz toy the forecast horizon grew 2.51 time units per tenfold gain in precision, against 2.54 from theory, with linear R2 0.99994; twelve levels of precision, from one decimal digit to twelve, moved the horizon from 1.2 to 28.7 time units. The gain per decade over the last three decades was 1.02 times that over the first three. Figure 3 shows the line.
c5 observed, evidence for claim 5
- The numbers in claim 5
- 2.51; 2.54; 2; 0.99994; 1.2; 28.7 matches the result file, 2026-11-09
- Chart 4
- Lorenz toy: how far ahead a forecast holds as the starting measurement gets more precise.
- Basis
- observed: measured in this study, with a result file
median forecast horizon (time units; higher is longer)
precision of the starting state (decimal digits; each step is ten times more precise)
- Measured median horizon
- Theory slope, through the first point
Data behind chart 4 12 rows
| Precision (decimal digits) | Median horizon (time units) | Theory line through the first point |
|---|---|---|
| 1 | 1.17 | 1.17 |
| 2 | 3.56 | 3.71 |
| 3 | 6.16 | 6.25 |
| 4 | 8.54 | 8.80 |
| 5 | 11.25 | 11.34 |
| 6 | 13.62 | 13.88 |
| 7 | 16.21 | 16.42 |
| 8 | 18.55 | 18.97 |
| 9 | 21.23 | 21.51 |
| 10 | 23.73 | 24.05 |
| 11 | 26.26 | 26.60 |
| 12 | 28.71 | 29.14 |
Read from result.json (second run), run 20261029T175624Z. SHA-256 of the run's file 647459dee912cbd1b40821fdfef1870481369fd248e04d953b6b0d1163cb49e5 and of the published copy af03b038e44458e40cf59ffd2388813fa6c9132d66a6a20092333a4c0b03ac5a. In the copy, file paths are cut to the file name and the layout (indentation, line endings) may differ; every value is the same.
In the crowd toy with steep reaction ( = 20) and 1,000 members, an unpublished forecast with every member measured scored R2 1.00, the same forecast published naively scored -1.55, and a fixed-point forecast that solves for the reaction scored 0.9999. Measuring 100 of the 1,000 members cut the fixed-point forecast to 0.40 while the unpublished one scored 0.98. With identical members there is no fixed point, and the best published forecast scored -0.02.
In the overfitting check, plain least squares with 150 variables on 150 forecasters fitted the training data at R2 0.96 and scored -135,817 held out. Ridge on shuffled targets stayed at or below -0.005 at every count, and ridge on real targets reached 0.067 with all variables. P5 failed on its own wording, because it asked for a training R2 of at least 0.99 at 150 variables and got 0.96; every other rule in it held.
Discussion
The direction of the hope holds: skill grows with measured variables in every target and always beats the shuffled control. The strong form fails. In four of the five targets with a valid ceiling, the model stops between 0.18 and 0.65 of the way there, and the remainder is mostly reliable signal, not noise.
The exception teaches the most. The similarity variables were learned from the same triplet corpus, so they were built for the target, and they reach the ceiling. Our 0.660 sits close to the ceiling near 0.67 that Hebart and colleagues reported for an earlier version of the task [3], which we read at the level of abstracts. Variables chosen because they were available, not because they were fitted to the target, stall.
The gaps closed most when a different kind of variable arrived. For forecasters this agrees with Himmelstein, Atanasov and Budescu [5]: past accuracy beats the trait battery. For trees, prior growth beats size, site and stand. A target's own history carries signal its present description misses.
Salganik and colleagues [1] found that many methods on rich data barely beat a simple benchmark. Our ceilings add a reading of that kind of result: a stall well below the noise ceiling says the missing information is in the world and not in the measurement error, so a different measurement can still help.
The toys bound the hope from the other side. With an exact model, chaos turns each tenfold gain in precision into a fixed slice of forecast time. A published forecast that people react to can be right only when the forecaster can solve for the reaction, and that solution degrades fast when most of the crowd is unmeasured.
The tierDefinition: tier our publication register How ready a finding is to publish: A candidate, B signal worth expanding (B* strong), C internal, D honest null worth reporting, E not reliable as it stands. Excludes a measure of how large or how true an effect is. full definition B* places this as a strong signal worth expanding. A rerun with non-linear learners and a preregistered tree ceiling on fresh splits would raise it.
Limitations
- Ridge and logistic models may leave signal that a non-linear model would find. A stall may belong to the model class.
- The datasets are a convenience sample of what was at hand, and only variables available in them were tried.
- The mood ceiling is a lower bound, the music rater count is assumed, and the tree ceiling estimator failed. A post hoc estimate in our ledger, outside the verdict and not in the result file, puts the tree ceiling at 0.74 to 0.82.
- The second run was not blind. Its one change, clipping, was fixed in a file hashed after the first run had been read.
- Several plateau intervals reached the fit bound, so they carry little information, and the P2 rule could not pass for those targets.
- The similarity task's shuffled control sits above chance by construction.
- The toys model their stated mechanisms only and say nothing direct about weather or markets.
- Scoring was done by our own code and was not blind.
Evidence
Mixed. Four of the six preregistered verdicts failed. One target reached 0.8 of its ceiling against a forecast of at least four, and one plateau moved when a new kind of variable arrived against a forecast of at least three. Held-out skill did rise with added variables and beat its shuffled control in every target, and the two toy-model verdicts passed.
Figures
These are the paper's own figures, numbered as in the PDF, and each "Figure" reference in the text points here. The charts on this page redraw the same results from the result files and carry their own numbers.
Tables
| Target | Variables | Skill | Ceiling | Share | With strong | Shuffled 95th |
|---|---|---|---|---|---|---|
| Similarity triplets (accuracy) | 66 | 0.655 | 0.660 | 0.985 | none named | 0.439 |
| Mood at next beep (R2) | 31 | 0.521 | 0.798 | 0.653 | 0.553 | 0.005 |
| Music valence (R2) | 22 | 0.445 | 0.821 | 0.542 | 0.527 | 0.005 |
| Music arousal (R2) | 22 | 0.393 | 0.862 | 0.455 | 0.484 | 0.013 |
| Forecaster accuracy (R2) | 1,349 | 0.131 | 0.714 | 0.183 | 0.360 | 0.004 |
| Tree growth (R2) | 42 | 0.396 | failed | none | 0.639 | 0.005 |
| Tree death (AUC) | 42 | 0.686 | none | none | 0.702 | 0.531 |
Appendix A. The preregistered verdicts
Each verdict is a set of rules written before the first run. A verdict passes only when every rule holds. Values are read from the second run's result file. P6, the identification test on a private image collection, is omitted.
| Verdict | Deciding rules | Value | Holds |
|---|---|---|---|
| P1 | at least 4 of 6 targets at 0.8 of ceiling or more | 1 of 6 | no |
| P2 | at least 3 of 7 plateaus moved by the strong variable | 1 of 7 | no |
| P3 | linear R2 at least 0.98; slope within 0.75 to 1.25 of theory; late to early decade gain within 0.75 to 1.33 | 0.99994; 0.988; 1.015 | yes |
| P4 | unpublished R2 at least 0.99; naive published R2 below 0.5; fixed point R2 at least 0.95; 100 of 1,000 measured costs at least 0.2; identical members below 0.5 | 1.00; -1.55; 0.9999; 0.58; -0.02 | yes |
| P5 | every target above its shuffled 95th percentile; least squares at 150 variables below 0 held out and at least 0.99 in training; shuffled ridge at most 0.02; real ridge above 0 | all above; -135,817 and 0.96; -0.005; 0.067 | no |
Numbers recorded in our publication register
| What | Value |
|---|---|
| Sample | 8 datasets; n 1744 to 150000; 22 to 1349 variables |
| Main estimate and interval | forecaster plateau 0.137 (0.118 to 0.155); other plateau intervals often hit the bound of the fit (up to 2.0) |
| Forecast against outcome | 1 of 6 targets at its ceiling against a forecast of at least 4; 1 plateau moved against at least 3; the two toy-model forecasts passed; an identification test on the private image collection, left out of the paper, missed its bar at -0.221 |
| Known-answer check | Lorenz forecast horizon 2.51 per tenfold precision against 2.54 from theory; an overfitting demonstration |
As recorded in the publication register, the summary row each finding gets; the paper's own numbers above were re-read from the result files.
What lowers it
- blinding Not blind. The second run corrects a clipping fault found by reading the first run. from our publication register, on blinding
- failed check Controls: working: all eight targets beat their shuffled-target control; failed: the tree ceiling estimator (-3.96); the overfitting rule asked for a training fit of 0.99 and got 0.96, a bar we set wrongly. from our publication register, on controls
- novelty Nearby work exists; novelty is not shown. from our publication register, on the literature
- depth of reading The cited literature was read at the level of abstracts, repository records and publisher pages; full texts were not read. from the Verified section
What holds it up
- scoring Scored by code against rules fixed in advance. from our publication register, on who scored it
- preregistration Preregistered and hash-locked before the run (sha256 ee38c3bd). from the Reproduce section
- open data Part of the data is public and part is not; the data licence line under Reproduce says which. from our publication register, on the data licence
Where the claim stands
- lead
- hypothesis
- thesis
- conjecture
- theorem
- law candidate
- killed
A preregistration with pass-or-fail rules is on file, which this rung needs. The next rung needs a named rival reading beaten by a decisive observation, and none is on file. Tier B*: Real data across domains with working nulls, and an unusual side-by-side view. The second run is not blind, one ceiling failed, the core forecasts failed, and linear models cannot rule out nonlinear signal. The past-performance finding is known.
Trail
Versions
- v3 2026-11-14, this page corrected, 1 item; the PDF and its BuildTeX source are still paper version 1.0
- v2 2026-11-09, paper version 1.0, first published PDF sha256 633238f22619b8d3
- v1 2026-10-29, entered in the findings ledger
Corrections
2026-11-14 number found by a review of the published pages
A review of the published page found three statements that did not match the result file. now The summary under the title said five of six targets stopped between 0.18 and 0.65 of their ceiling and that the gap closed when a different kind of variable arrived; the file gives four of the five targets with a valid ceiling, and one plateau of seven moved, so the summary now says that. The design section described the third forecast as the last three decades gaining no more than the first three; the locked rule is a ratio between 0.75 and 1.33, and the section now says so. The charts are drawn from all eight targets in the result file, including the image-preference target that the text leaves out, and the first chart now says so. The outcome word changed from held to mixed, because four of the six preregistered verdicts failed.
2026-11-09 scope found by the publication pass
The identification test and the target built on a private image collection are left out.
2026-10-29 wording found by the study itself, before publication
The addendum recorded three defects left in place on purpose: the failed tree ceiling estimator, the P2 rule that cannot pass for an unflattened curve, and the similarity control's above-chance start.
2026-10-29 wording found by the study itself, before publication
The first run's forecaster R2 of -1.686 came from unclipped scaling of nearly constant variables. now A disclosed addendum clipped scaled values at 5 in either direction and nothing else; the second run is primary and not blind.
Each correction is a dated note; the findings ledger is never rewritten, and a note governs where it differs.
Ledger and version dates up to publication are local dates in US Pacific time. Clock times in the text are UTC, seven or eight hours ahead, so a lock or a run stamped just after midnight UTC belongs to the previous local day. Corrections from 14 November 2026 on are dated in UTC.
References
- Salganik, M. J., Lundberg, I., Kindel, A. T. and others (2020). Measuring the predictability of life outcomes with a scientific mass collaboration. Proceedings of the National Academy of Sciences 117(15), 8398-8403. doi:10.1073/pnas.1915006117 abstract or summary, 2026-11-09: abstracts, repository records and publisher pages; full text not read used in Introduction and motivation, Discussion
- Lage-Castellanos, A., Valente, G., Formisano, E. and De Martino, F. (2019). Methods for computing the maximum performance of computational models of fMRI responses. PLOS Computational Biology 15, e1006397. doi:10.1371/journal.pcbi.1006397 abstract or summary, 2026-11-09: abstracts, repository records and publisher pages; full text not read used in Introduction and motivation
- Hebart, M. N., Zheng, C. Y., Pereira, F. and Baker, C. I. (2020). Revealing the multidimensional mental representations of natural objects underlying human similarity judgements. Nature Human Behaviour 4(11), 1173-1185. doi:10.1038/s41562-020-00951-3 abstract or summary, 2026-11-09: abstracts, repository records and publisher pages; full text not read used in Introduction and motivation, Discussion
- Hebart, M. N., Contier, O., Teichmann, L. and others (2023). THINGS-data, a multimodal collection of large-scale datasets for investigating object representations in human brain and behavior. eLife 12, e82580. doi:10.7554/eLife.82580 run here Licence: mixed: DEAM CC BY-NC; the Good Judgment Project, Forest Inventory and THINGS data each under their own terms; the image collection is private and is not published used in Data and provenance
- Himmelstein, M., Atanasov, P. and Budescu, D. V. (2021). Forecasting forecaster accuracy: contributions of past performance and individual differences. Judgment and Decision Making 16(2), 323-362. doi:10.1017/S1930297500008597 abstract or summary, 2026-11-09: abstracts, repository records and publisher pages; full text not read used in Introduction and motivation, Discussion
- Aljanaki, A., Yang, Y.-H. and Soleymani, M. (2017). Developing a benchmark for emotional analysis of music. PLoS ONE 12(3), e0173392. doi:10.1371/journal.pone.0173392 run here Licence: mixed: DEAM CC BY-NC; the Good Judgment Project, Forest Inventory and THINGS data each under their own terms; the image collection is private and is not published used in Data and provenance
- Good Judgment Project. GJP data. Harvard Dataverse, CC0 1.0. doi:10.7910/DVN/BPCDH5 run here Licence: mixed: DEAM CC BY-NC; the Good Judgment Project, Forest Inventory and THINGS data each under their own terms; the image collection is private and is not published used in Data and provenance
- USDA Forest Service. Forest Inventory and Analysis database, Washington and Oregon. FIA DataMart. run here Licence: mixed: DEAM CC BY-NC; the Good Judgment Project, Forest Inventory and THINGS data each under their own terms; the image collection is private and is not published used in Data and provenance
- openESM. Experience sampling dataset 0062 (Neubauer). CC BY 4.0. run here Licence: mixed: DEAM CC BY-NC; the Good Judgment Project, Forest Inventory and THINGS data each under their own terms; the image collection is private and is not published used in Data and provenance
- Measurement-bounded predictive inference in international large-scale assessment: how the plausible-value ceiling governs attainable accuracy and the stability of predictor rankings in PISA 2022. Research Square preprint rs-10732065 (authors and date not read; seen as a search summary). abstract or summary, 2026-11-09: abstracts, repository records and publisher pages; full text not read used in Introduction and motivation
Cited by later findings
- No later record in the findings ledger treats this finding.
Reproduce
Data
- Hebart 2023. Licence: mixed: DEAM CC BY-NC; the Good Judgment Project, Forest Inventory and THINGS data each under their own terms; the image collection is private and is not published. https://doi.org/10.7554/eLife.82580
- Aljanaki 2017. Licence: mixed: DEAM CC BY-NC; the Good Judgment Project, Forest Inventory and THINGS data each under their own terms; the image collection is private and is not published. https://doi.org/10.1371/journal.pone.0173392
- Good Judgment Project. Licence: mixed: DEAM CC BY-NC; the Good Judgment Project, Forest Inventory and THINGS data each under their own terms; the image collection is private and is not published. https://doi.org/10.7910/DVN/BPCDH5
- USDA Forest Service. Licence: mixed: DEAM CC BY-NC; the Good Judgment Project, Forest Inventory and THINGS data each under their own terms; the image collection is private and is not published.
- openESM. Licence: mixed: DEAM CC BY-NC; the Good Judgment Project, Forest Inventory and THINGS data each under their own terms; the image collection is private and is not published.
Preregistration
sha256 ee38c3bd5b2a255fe65bbe3c94c895bde618261da9a2c638e16fce87f2f7b602
plan 7ae9de2b411eaa112e2644a19075028358534a613be6439c97d6fd040b9b33d9
Steps
- Data: Forest Inventory and Analysis for Washington and Oregon [8]; openESM dataset 0062 [9]; DEAM static ratings [6]; Good Judgment Project data [7]; THINGS odd-one-out triplets and the 66 object dimensions [4].
- Hold out by plot, by each person's last 30 percent of beeps, by artist, by forecaster and by between-subject repeated triplets. Add variables in 8 random orders and correlation order at about 14 counts; refit and score held out at each count. Clip scaled values at 5 in either direction.
- Compute each ceiling from the data's own repeats and the share with eq. 2. Fit eq. 3 to the curves. Refit each target on shuffled training labels 20 times.
- For the toys, integrate Lorenz-63 from perturbed states until the error norm exceeds 1, and simulate the crowd with the attendance rule in the methods.
- Preregistration SHA-256: ee38c3bd5b2a255fe65bbe3c94c895bde618261da9a2c638e16fce87f2f7b602. Addendum SHA-256: e722f68052046c926fe562f66bfb368fef7b6c3120dc28de781b861e727e4d54. Plan SHA-256: 7ae9de2b411eaa112e2644a19075028358534a613be6439c97d6fd040b9b33d9. Runs 20261029T172001Z and 20261029T175624Z (primary).
Cost. The second run took about 16 minutes on one desktop computer, most of it in the forecaster and similarity targets. The study was not re-run for this paper.
Downloads
- Whitepaper, PDF F47.pdf, 618 KB
- BuildTeX source F47.bld, 38 KB
- Build receipt F47.buildtex.json, 1 KB
- BuildLang doc module doc.bld, 5 KB, imported by the source
The PDF is typeset by BuildTeX from F47.bld, which is written from the same source as this page. The receipt records the source's SHA-256 and the PDF's (633238f22619), so anyone can rebuild it and compare. The copy here has its hidden author field blanked, as the site does for every file it publishes; blank the same field in a rebuild before comparing. The name stays on the first page.
Verified
Verified on 2026-11-09. On 9 November 2026 every skill, ceiling, share, strong-variable value, variance split, plateau fit, control bar, case count, toy value, overfitting value and verdict in this paper was re-read from the second run's result file, and the first run's forecaster R2 of -1.686 from the first run's result file. These match the findings ledger to rounding; the tree ceiling reads -3.9645 in the file and -3.97 in the ledger. Both preregistration files' SHA-256 values match their hash files and the hashes recorded in the two result files. The post hoc tree ceiling of 0.74 to 0.82 was read from the ledger only. All three figures were drawn by a script that reads only the second run's result file.
Not checked. The study was not re-run for this paper. The literature was found by searches run on 9 November 2026 and read at the level of abstracts, repository records and publisher pages; the full texts were not read.
Terms on this page
Each term is defined where it is first used on this page. Each name below opens its entry in the findings glossary, which lists every page that uses it.
- noise ceiling measurement theory and computational neuroscience first use
- preregistration research method (metascience) first use
- verdict research method (our usage) first use
- Brier score forecast verification (meteorology) first use
- held-out skill statistics and machine learning first use
- AUC statistics (signal detection) first use
- ridge regression statistics first use
- parallel forms psychometrics first use
- split-half reliability psychometrics first use
- share of ceiling our usage first use
- saturating curve curve fitting first use
- strong variable our usage in this study first use
- forecast horizon dynamical systems (chaos) first use
- reflexive forecast economics and social science first use
- control statistics and experimental design first use
- null distribution statistics first use
- planted check research method; called a positive control in experimental science first use
- honest null research method (our usage) first use
- tier our publication register first use
To report an error, name the finding, the claim number and the source on the Work page, which gives the address. Accepted corrections join the Trail with their date.