
Findings F33 Plants, trees and earth, Biology and medicine found 2026-10-29
Cedar decline and water: observer site calls show no pattern either way
Among 912 western redcedars whose observer described the site, decline was about as common on wet ground as on dry: odds ratio 1.11, with an interval from 0.65 to 1.75 that leaves either direction open. Every water measure is a person's call at the tree, and people recording a declining tree answered the question more often, so the result is undecided.
- Tier
- B, signal
- Outcome
- inconclusive
- Rung
- hypothesis
- Corrections
- 2, latest 2026-11-14
- Version
- v3, 2026-11-14
- Redo it
- Reproduce
Download PDF 483 KB BuildTeX source F33.bld
What this means for a reader
People who record sick and healthy cedars also note whether the tree stands on a wet site. Those notes show cedars declining about as often on wet ground as on dry, with a range wide enough to hide a real difference of up to about 75 percent higher odds or 35 percent lower. This is an undecided result from a weak instrument. It does not show that cedar decline ignores water, because every water measure here is a person's judgement at the tree, and people who saw a sick tree filled in that judgement more often.
Objection
Every water measure is an observer's or a crew's call at the tree or plot. No distance to a mapped stream was computed.
What would change the call. Mapped water layers and an elevation model for all 4,184 located cedars, with each declining cedar paired to the nearest healthy one of similar size.
From the paper's first stated limitation; our register records no separate objection.
Abstract
Western redcedar is dying back across the Pacific Northwest, and a field observation by the author holds that the decline follows waterways. A drought reading predicts that water nearby protects a tree. We tested both directions with a plan fixed in advance, on 4,184 located cedar observations from a community science project and 1,545 cedar records from monitored park plots in Seattle. On the primary measure, 87 of 169 cedars on wet sites were declining (51.5 percent) against 347 of 743 on upland sites (46.7 percent), an adjusted odds ratio of 1.11 (95 percent interval 0.65 to 1.75). Compared only with cedars in the same 5 km cell the odds ratio was 0.95, inside the shuffle range of 0.61 to 1.63. By the rule fixed in advance the result is undecided: neither direction passed on any of the four cedar measures. Declining observations answered the hydrology question more often than healthy ones, 64.5 against 52.2 percent, so the primary field is selected on health. Bigleaf maple on water-flagged park plots was stressed in 27 of 463 records (5.8 percent) against 353 of 3,188 (11.1 percent), an adjusted odds ratio of 0.42 (0.17 to 0.88); on the second water measure, wet soil or wetland canopy, the maple odds ratio was 0.84 (0.22 to 2.00). The cedar question stays open, and the paper names the mapped data that would settle it.
c1 observed, evidence for claim 1
- The numbers in claim 1
- 87; 169; 51.5; 347; 743; 46.7; 1.11; 95; 0.65; 1.75 matches the result file, 2026-11-14
- Chart 1
- How the water question was put to observers' site calls, and how it came out.
- Chart 2
- Odds of decline or stress on wet sites against dry ones, every measure.
- Basis
- observed: measured in this study, with a result file
c2 observed, evidence for claim 2
- The numbers in claim 2
- 5; 0.95; 0.61; 1.63 matches the result file, 2026-11-14
- Basis
- observed: measured in this study, with a result file
c3 observed, evidence for claim 3
- Chart 1
- How the water question was put to observers' site calls, and how it came out.
- Basis
- observed: measured in this study, with a result file
- Numbers
- None in the sentence; it reads the numbers stated beside it.
c4 observed, evidence for claim 4
- The numbers in claim 4
- 64.5; 52.2 matches the result file, 2026-11-14
- Basis
- observed: measured in this study, with a result file
c5 observed, evidence for claim 5
- The numbers in claim 5
- 27; 463; 5.8; 353; 3,188; 11.1; 0.42; 0.17; 0.88; 0.84; 0.22; 2.00 matches the result file, 2026-11-14
- Chart 2
- Odds of decline or stress on wet sites against dry ones, every measure.
- Basis
- observed: measured in this study, with a result file
Introduction
Western redcedar (Thuja plicata) has been dying back in Washington and Oregon in recent years. A 2022 report by the Washington Department of Natural Resources with state and federal partners [5] mapped dieback sites and, in the search summaries we read, found them concentrated at low elevation in the urban corridors of western Washington and northwestern Oregon, with low spring precipitation as snow the leading climate predictor on the west side and no site factor tied to worse crown condition in individual trees. A forest health alert issued the same year [6] says cedars are dying in shaded places beside streams and links that to higher temperatures and reduced stream flow.
Those two statements pull in different directions for anyone standing at a stream. If drought is the cause, a tree with water nearby should fare better. If trees beside streams are dying, something about wet sites may add risk: a shallow root system that cannot follow a falling water table, or root disease in wet soil. The author recorded the field observation that cedar decline "follows waterways". An earlier round of this study, ledger entry F25, could not test it: the national forest inventory it used holds no waterway field.
This round asks the narrower question that public data can reach. Among recorded cedars, is decline more common, or less common, on sites an observer called wet? The decision it informs is whether the waterway hypothesis is worth the cost of mapped stream and elevation layers. Our searches returned agency reports and a graduate thesis on topography and drought [7], and no study of decline against distance to water; that is what the searches returned and no proof that none exists.
Preregistration and design
The preregistrationDefinition: preregistration research method (metascience) A dated written plan for a study, fixed and hash-locked before any result is seen: the question, the data, the statistic, the controls, the forecasts and the kill conditions. Excludes a plan revised after looking at the outcome, and a protocol written only for the record after the run. full definition, a dated plan fixed and hash-locked before any result is seen, was locked at 15:06:16 UTC on 29 October 2026. Before it was written we had seen field names, counts per field level and the total number of records in each health class. The code had been run once with health labels shuffled at random. No real health label had been crossed with any water field.
The plan records a prior for the primary measure: probability 0.25 that decline is detectably higher on wet sites, 0.40 that it is detectably lower, and 0.35 that these data can detect no difference. It names twelve verdictsDefinition: verdict research method (our usage) The pass or fail of one preregistered rule set against the run's numbers, read off by code. Excludes an interpretation written after reading the numbers. full definition, each a rule set read off by code as pass or fail. An "author" verdict passes when wet sites show more decline and a "drought" verdict when they show less. The overall reading was fixed in advance: supported if the author verdict passes on the primary measure with its observer check and no drought verdict passes elsewhere, opposed if the drought verdict passes on the primary measure, and otherwise undecided.
Data and provenance
Three public sources were used, fetched on 29 October 2026. We report counts and statistics only. No observer name, login, note or photo was read, and records with obscured or private coordinates, 18 in all, were left out.
- The Western Redcedar Dieback Map [1], a community scienceDefinition: community science ecology (data collection) Records made by volunteers, here photographs of trees with a location and answers to a short form, gathered on a public platform. Excludes a designed sample: volunteers choose which trees to record, so shares in the data are not rates in the forest. full definition project on iNaturalist in which volunteers record a cedar with its location and canopy symptoms; people choose which trees to report, so shares of declining trees are not population rates. Each observation keeps its own licence, mostly CC BY-NC, with about a third all rights reserved. It gave 4,184 usable cedar observations, 1,427 of them declining.
- The Maple Health Watch project on iNaturalist [2], same terms, with 349 usable bigleaf maple observations.
- Hulbert's public redcedar repository [3], CC0 1.0 for his own work, which holds 2021 and 2022 exports of the cedar project. The current project no longer carries the site hydrology and slope position fields; these exports hold them for earlier observations, so the primary test covers 2020 to 2022.
- Green Seattle Partnership Forest Monitoring [4], tree records from plots placed in Seattle parks: 1,545 western redcedar records with 47 rated stressed, and 3,651 bigleaf maple records with 380 stressed. The service names no licence and carries a City of Seattle disclaimer. Trees are not tagged across visits, so one tree can appear twice.
No stream map and no elevation model were available to the study, so distance to water was not computed.
Methods
Outcome and water measures
A cedar observation is healthy when its canopy field says so and declining when it reports thinning, a dead top, branch dieback, browning, yellowing, multiple symptoms or a dead tree. Four cedar measures sort trees into wet and dry:
- Site hydrology, the primary measure: wet is "seasonally flooded area" or "wetland, lots of water"; dry is "upland or well drained".
- Slope position: wet is riverbank, floodplain or valley bottom; dry is every other position.
- Access to water: wet is year-round access, which includes trees watered in summer; dry is no typical access in summer.
- For park plots, a water flag: the visit's features text names a stream, seep, wetland, lake, spring, creek, pond or wet spot.
Estimates
The main estimate is an odds ratioDefinition: odds ratio statistics The odds of decline on wet sites divided by the odds on dry sites, where odds are the probability of decline over the probability of no decline. 1 means no difference. Excludes a ratio of probabilities, and a causal effect. full definition from logistic regressionDefinition: logistic regression statistics A model in which the log odds of the outcome are a weighted sum of predictors, here a wet-site indicator and site covariates. Excludes any account of which trees came to be recorded. full definition. With the probability that a tree is declining, equal to 1 on a wet site and 0 on a dry one, and covariates ,
and the adjusted odds ratio is the exponential of . A value of 1 means the same odds on wet and dry sites; an odds ratio is a ratio of odds and says nothing of cause. Covariates for community observations are site type, disturbance level and observation year; for park plots, stem diameter, edge features, canopy cover, soil compaction and visit period. Each 95 percent intervalDefinition: 95% interval statistics The range that holds the middle 95 percent of the bootstrap or control draws for a number. We report it beside the number. Excludes a statement that the true value lies inside with 95 percent probability. full definition is the middle 95 percent of a cluster bootstrapDefinition: cluster bootstrap statistics An interval made by refitting the model many times, here 1,000, on whole sites or plots drawn with replacement, so trees from one place stay together. Excludes resampling single trees as if they were independent. full definition: 1,000 refits on whole sites, or whole plots, drawn with replacement, so trees from one place stay together.
The second estimate compares trees only with their neighbours. A site is a grid cell of 0.05 degrees of latitude by 0.075 of longitude, about 5.5 km square, or a park. The Mantel-Haenszel odds ratioDefinition: Mantel-Haenszel odds ratio epidemiology and statistics One odds ratio pooled across strata, here sites, from the two-by-two table of wet or dry against declining or healthy inside each site. Excludes sites that hold only wet or only dry trees, which add nothing to it, and differences between sites. full definition pools the wet-against-dry comparison across sites:
where in site , and are the declining and healthy trees on wet ground, and the declining and healthy trees on dry ground, and the site's total. Only sites holding both wet and dry trees contribute, so regional differences between cells cannot drive it.
Controls and planted checks
Each controlDefinition: control statistics and experimental design A version of the data with the structure under test removed (for example shuffled or pooled), scored the same way as the real data, so the real score has something to beat. Excludes a comparison with a different dataset or with a published number. full definition is the data with one link broken, scored by the same code.
- data912 cedars with a site callCommunity observations with a hydrology answer, 2020 to 2022: 87 of 169 declining on wet sites, 347 of 743 on upland sites.
- measurementOdds ratio, wet against dryAdjusted for site type, disturbance and year. A value of 1 means the same odds of decline on wet and dry sites.
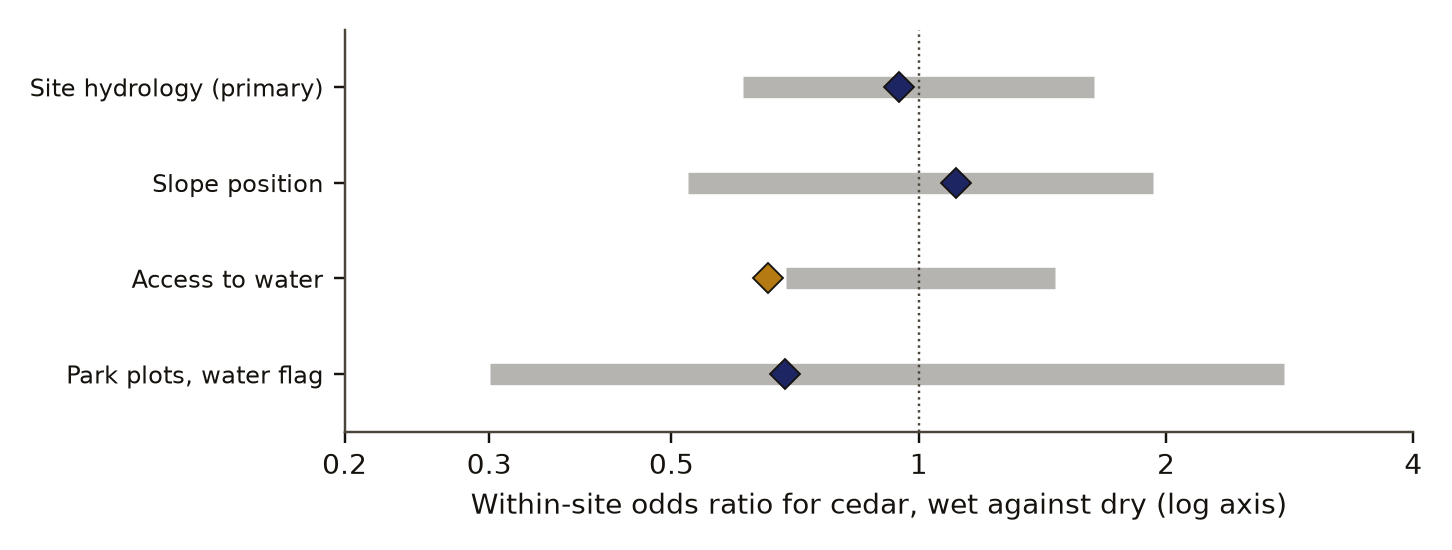
- controlControl: labels shuffled within siteHealth labels shuffled inside each 5 km cell, 1,000 times. The within-cell odds ratio of 0.95 sits inside the shuffle's 5th to 95th percentile range, 0.61 to 1.63.
- rule set in advanceRule: one direction must passSupported if wet sites show more decline on the primary measure with its observer check; opposed if they show less; otherwise undecided.
- undecidedNeither direction passedThe interval leaves an odds ratio of 1.5 open either way, and declining observations answered the water question 12.3 points more often than healthy ones, against a limit of 5.
Read from result.json, run 20261029T150625Z. SHA-256 of the run's file be022ec37e9de1722232d553b0d721d5060480768bc8848454b94ec14b668b3b and of the published copy 296496d6b98798e24f5f52c11a52b5b7ee391c0aff46c0125ce564115a56f332. In the copy, file paths are cut to the file name and the layout (indentation, line endings) may differ; every value is the same.
- Health labels shuffled within site, 1,000 times per measure, give the null distributionDefinition: null distribution statistics The spread of scores a control gives over many random draws. Its 95th percentile is the bar a real score must clear. Excludes a theoretical distribution assumed rather than drawn from the data. full definition of the Mantel-Haenszel estimate. Its 5th and 95th percentiles are the bars for the drought and author verdicts.
- Bigleaf maple is the comparison species: the same estimate on the same plots and the same access field. A cedar effect counts as specific to cedar only if it lies beyond the 95th percentile of maple's bootstrap.
- Observer draws: the wet share among declining cedars against random draws of the same size from all cedars with hydrology known.
- Fill rateDefinition: fill rate survey methods, our usage The share of observations in which the observer answered an optional question, compared between declining and healthy trees. Excludes what the answers were; it measures only who answered. full definition: the share of declining and of healthy observations whose observer answered the optional water question. A gap of 5 points or more means the field is selected on health. This check can show observer bias, which the draws cannot, since they are tied to the main effect by arithmetic.
This study has no planted check, a run on data with a known built-in effect. The shuffle nulls all centred on an odds ratio of 1, with log means within 0.04 of zero.
Results
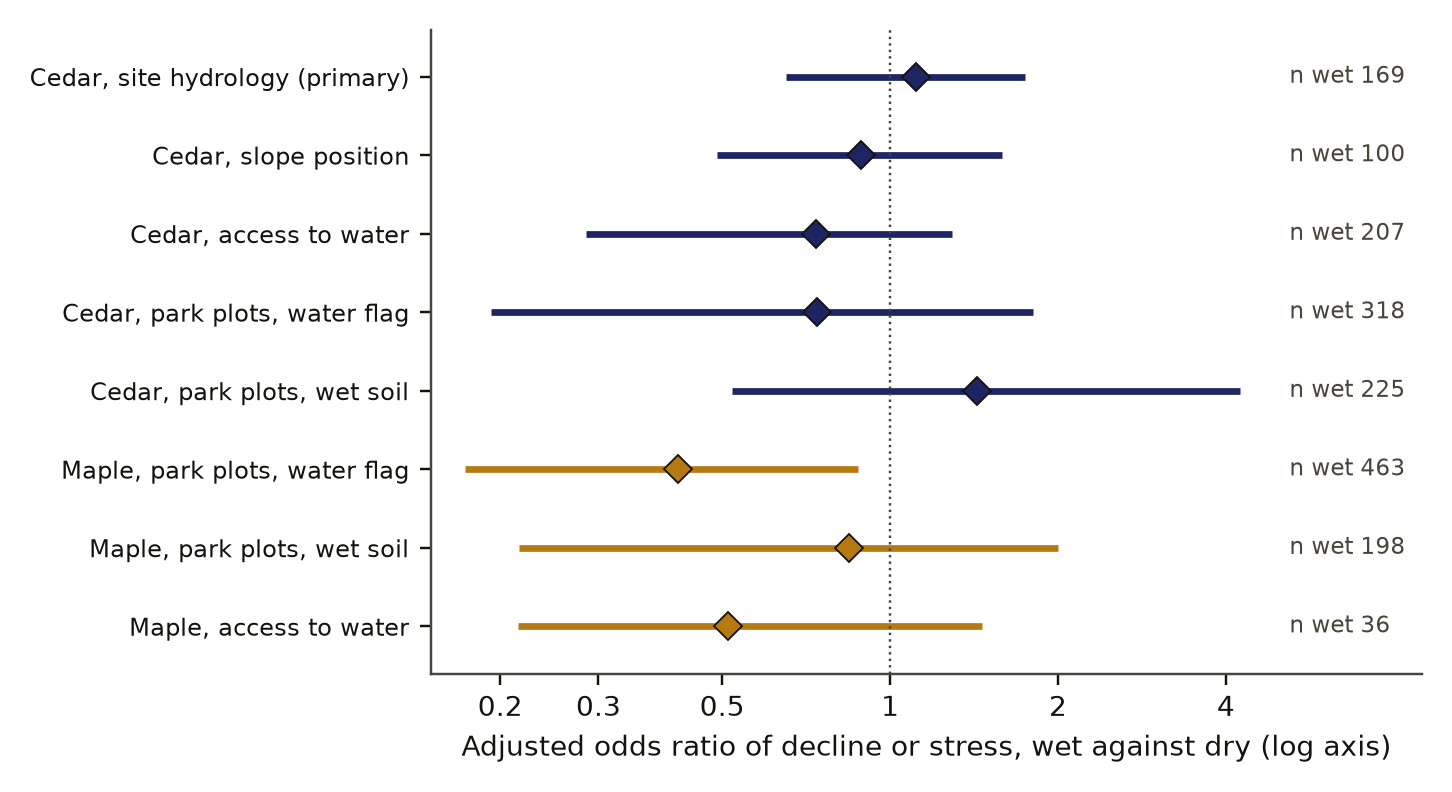
On the primary measure, 87 of 169 cedars on wet sites were declining (51.5 percent) against 347 of 743 on upland sites (46.7 percent), an adjusted odds ratio of 1.11 (95 percent interval 0.65 to 1.75). Compared only with cedars in the same 5 km cell the odds ratio was 0.95, inside the shuffle range of 0.61 to 1.63. On the 530 observations with an elevation, adding elevation gave 0.98 (0.59 to 1.58). Table 1 and Figure 1 give every measure.
adjusted odds ratio, wet against dry, log scale
- Western redcedar
- Bigleaf maple
- 95% cluster-bootstrap interval, the exponential of the stored log values
- same odds, 1
Data behind chart 2 8 rows
| Measure | Wet, n | Share wet (%) | Share dry (%) | Odds ratio | Low | High |
|---|---|---|---|---|---|---|
| Cedar, site hydrology (primary) | 169 | 51.5 | 46.7 | 1.11 | 0.65 | 1.75 |
| Cedar, slope position | 100 | 49.0 | 48.9 | 0.89 | 0.49 | 1.59 |
| Cedar, access to water | 207 | 29.5 | 38.6 | 0.74 | 0.28 | 1.29 |
| Cedar, park plots, water flag | 318 | 2.2 | 3.3 | 0.74 | 0.19 | 1.81 |
| Cedar, park plots, wet soil | 225 | 4.0 | 2.9 | 1.43 | 0.52 | 4.23 |
| Maple, park plots, water flag | 463 | 5.8 | 11.1 | 0.42 | 0.17 | 0.88 |
| Maple, park plots, wet soil | 198 | 9.6 | 10.5 | 0.84 | 0.22 | 2.00 |
| Maple, access to water | 36 | 44.4 | 55.6 | 0.51 | 0.22 | 1.46 |
Read from result.json, run 20261029T150625Z. SHA-256 of the run's file be022ec37e9de1722232d553b0d721d5060480768bc8848454b94ec14b668b3b and of the published copy 296496d6b98798e24f5f52c11a52b5b7ee391c0aff46c0125ce564115a56f332. In the copy, file paths are cut to the file name and the layout (indentation, line endings) may differ; every value is the same.
By the rule fixed in advance the result is undecided: neither direction passed on any of the four cedar measures. The access field came nearest. Its within-site odds ratio of 0.66 fell below the shuffle's 5th percentile of 0.69, but the adjusted interval crosses 1, so the drought verdict failed there too, and the field counts a watered garden tree as having access to water. On park plots only 7 stressed cedars stood on water-flagged plots against a required 10, and the features text that carries the flag is blank on 37.7 percent of cedar records. Figure 2 sets each within-site estimate against its shuffle range.
Declining observations answered the hydrology question more often than healthy ones, 64.5 against 52.2 percent, so the primary field is selected on health. The gap is 12.3 points against a limit of 5. For the access field the gap was 2.2 points (22.4 against 20.2 percent), which passed. The observer draws found the wet share among declining cedars at 20.0 percent, against 18.5 percent among all cedars with a hydrology answer and a 95th percentile of 20.7 percent in random draws (p 0.14). Park plots, which a programme placed, put 20.6 percent of cedar records on water-flagged plots, close to the 18.5 percent wet share in volunteers' answers.
Bigleaf maple on water-flagged park plots was stressed in 27 of 463 records (5.8 percent) against 353 of 3,188 (11.1 percent), an adjusted odds ratio of 0.42 (0.17 to 0.88); on the second water measure, wet soil or wetland canopy, the maple odds ratio was 0.84 (0.22 to 2.00). The water-flag interval is the only one in the study that excludes 1, and it is one of nine intervals reported here. Cedar's estimate on the same plots, 0.74, is not beyond the 95th percentile of maple's bootstrap, 0.78, so cedar's response to water is not shown to differ from maple's.
Two exploratory descriptions were planned and not scored. Observers reported heat damage, yes or maybe, on 32 percent of declining cedars on wet sites (31 answers) and 32 percent on dry sites (257 answers). They reported other factors such as insects or disease on 6.5 percent of wet-site cedars (168) against 10.6 percent of dry-site cedars (742). A root disease favoured by wet soil would predict more such reports on wet sites.
Discussion
The outcome fell in the third of the three prior cases, the one given probability 0.35: no difference these data can detect. With 169 wet-site cedars the primary interval runs from 0.65 to 1.75. A real odds ratio of 1.5 in either direction fits inside it. The field observation that decline follows waterways is neither supported nor refuted, and the drought reading is in the same position.
Three features of the instrument limit what any result from it could mean. A wet site is a judgement made by a person at the tree, and it carries no distance to a stream. People recording a declining tree described the site more often, and the direction of the bias that puts into a wet-against-dry comparison is unknown. The hydrology field stopped being collected in 2022, so a pattern that formed later, or one that exists only within a few tens of metres of a channel, would not appear.
The maple result is suggestive and no more. Maple near streams, seeps and wetlands in Seattle parks was stressed about half as often on one measure, which is the direction a drought reading predicts. The second water measure on the same trees shows no clear difference, so the maple result depends on which definition of wet is used.
What would settle the cedar question is a mapped water layer and an elevation model, so that all 4,184 located cedars get a distance to water with no observer call, and a paired design that matches each declining cedar to the nearest healthy one of similar size. The agency work cited above [5, 6] suggests where to look first: low elevations, and stream corridors with reduced summer flow.
Limitations
- Every water measure is an observer's or a crew's call at the tree or plot. No distance to a mapped stream was computed.
- The primary field is selected on health: declining observations answered it 12.3 points more often than healthy ones.
- The interval on the primary measure reaches 1.75 and falls to 0.65, so this is an undecided result and no evidence of absence.
- Community observations are opportunistic and the project asks for declining trees. The declining shares are not rates in the forest.
- The hydrology field covers observations from 2020 to 2022 only.
- "Access to water" mixes summer watering with natural water.
- Park plots cover forested Seattle parks only and rated 47 cedars stressed; 7 of them were on water-flagged plots.
- The maple result holds on one of two water measures and is the single interval excluding 1 among nine.
- There was no planted check.
- Scoring was done by our own code on observers' calls and was not blind.
Evidence
Inconclusive. Neither direction passed on any of four cedar measures. The primary interval runs from 0.65 to 1.75, so an odds ratio of 1.5 either way is not ruled out. The primary field failed its observer check: declining observations answered it 12.3 points more often than healthy ones, against a limit of 5. The maple result (odds ratio 0.42, interval 0.17 to 0.88) holds on one of two water measures; the other gives 0.84 (0.22 to 2.00).
Figures
These are the paper's own figures, numbered as in the PDF, and each "Figure" reference in the text points here. The charts on this page redraw the same results from the result files and carry their own numbers.
Tables
| Measure | Wet, n | Share wet, dry | Adjusted odds ratio | Within site |
|---|---|---|---|---|
| Cedar, site hydrology (primary) | 169 | 51.5, 46.7 percent | 1.11 (0.65 to 1.75) | 0.95 (0.61 to 1.63) |
| Cedar, slope position | 100 | 49.0, 48.9 | 0.89 (0.49 to 1.59) | 1.11 (0.52 to 1.93) |
| Cedar, access to water | 207 | 29.5, 38.6 | 0.74 (0.28 to 1.29) | 0.66 (0.69 to 1.46) |
| Cedar, park plots, water flag | 318 | 2.2, 3.3 | 0.74 (0.19 to 1.81) | 0.69 (0.30 to 2.78) |
| Cedar, park plots, wet soil | 225 | 4.0, 2.9 | 1.43 (0.52 to 4.23) | not scored |
| Maple, park plots, water flag | 463 | 5.8, 11.1 | 0.42 (0.17 to 0.88) | not scored |
| Maple, park plots, wet soil | 198 | 9.6, 10.5 | 0.84 (0.22 to 2.00) | not scored |
| Maple, access to water | 36 | 44.4, 55.6 | 0.51 (0.22 to 1.46) | not scored |
Appendix A. The preregistered verdicts
Each verdict is a set of rules written before the run and passes only when every rule holds. Odds ratios are shown in place of the stored log values. An "author" verdict needs the interval's lower bound above 1, the within-site estimate above the shuffle's 95th percentile, and a minimum count of declining wet trees. A "drought" verdict needs the upper bound below 1 and the within-site estimate below the shuffle's 5th percentile.
| Verdict | Deciding values | Holds |
|---|---|---|
| Author, site hydrology | lower bound 0.65; within site 0.95 against 1.63; 87 declining wet | fail |
| Drought, site hydrology | upper bound 1.75; within site 0.95 against 0.61 | fail |
| Author, slope position | lower bound 0.49; within site 1.11 against 1.93; 49 declining wet | fail |
| Drought, slope position | upper bound 1.59; within site 1.11 against 0.52 | fail |
| Author, access to water | lower bound 0.28; within site 0.66 against 1.46; 61 declining wet | fail |
| Drought, access to water | upper bound 1.29; within site 0.66 against 0.69 (this rule held) | fail |
| Author, park plots | lower bound 0.19; within park 0.69 against 2.78; 7 stressed wet, 10 needed | fail |
| Drought, park plots | upper bound 1.81; within park 0.69 against 0.30 | fail |
| Cedar beyond maple, park plots | cedar 0.74 against maple 95th percentile 0.78 | fail |
| Cedar beyond maple, access | cedar 0.74 against maple 95th percentile 1.18 | fail |
| Fill rate, site hydrology | gap 12.3 points, limit 5 | fail |
| Fill rate, access to water | gap 2.2 points, limit 5 | pass |
Numbers recorded in our publication register
| What | Value |
|---|---|
| Sample | 912 cedars with a site description, 169 of them on wet sites; 4,184 located cedars |
| Main estimate and interval | odds ratio 1.11 (0.65 to 1.75); maple on water-flagged plots 0.42 (0.17 to 0.88) |
| Forecast against outcome | Neither the waterways forecast nor the drought forecast passed on any cedar measure. The fill-rate check for the access field passed |
| Known-answer check | none |
As recorded in the publication register, the summary row each finding gets; the paper's own numbers above were re-read from the result files.
What lowers it
- blinding Not blind: the analyst saw the data's shape before the lock. from our publication register, on blinding
- missing control No positive control. from our publication register, on the known-answer check
- depth of reading The cited literature was read at the level of search snippets; full texts were not read. from the Verified section
What holds it up
- scoring Scored by code against rules fixed in advance. from our publication register, on who scored it
- preregistration Preregistered and hash-locked before the run (sha256 c7064ebb). from the Reproduce section
- control Controls: the within-site shuffle worked; the fill-rate check found selection on health in the primary field. from our publication register, on controls
- open data Public data under non-commercial terms. from our publication register, on the data licence
Where the claim stands
- lead
- hypothesis
- thesis
- conjecture
- theorem
- law candidate
- killed
A preregistration with pass-or-fail rules is on file, which this rung needs. The next rung needs a named rival reading beaten by a decisive observation, and none is on file. Tier B: Undecided, and not a powered null: the primary field is selected on health and the interval reaches 1.75. The question is open and the next step is named. No signal yet for cedar.
Trail
Versions
- v3 2026-11-14, paper version 1.0, first published PDF sha256 7cc45d9baabcd44b
- v2 2026-10-31, dated correction, 1 item
- v1 2026-10-29, entered in the findings ledger
Corrections
2026-11-14 scope found by the publication pass
Narrowed the maple statement. now The ledger says maple near water is stressed about half as often; that holds on the water-flag measure (odds ratio 0.42, interval 0.17 to 0.88) and does not hold on the wet-soil measure (0.84, interval 0.22 to 2.00), which the ledger entry does not mention.
2026-10-31 wording found by a review of our findings ledger
A review of our ledger noted that the entry named its preregistration and data record and no result file. now The result file exists and was read in full for this paper.
Each correction is a dated note; the findings ledger is never rewritten, and a note governs where it differs.
Ledger and version dates up to publication are local dates in US Pacific time. Clock times in the text are UTC, seven or eight hours ahead, so a lock or a run stamped just after midnight UTC belongs to the previous local day. Corrections from 14 November 2026 on are dated in UTC.
References
- iNaturalist. Western Redcedar Dieback Map, project 88444. Observations read through the public API on 29 October 2026. Per-observation licences, mostly CC BY-NC. https://www.inaturalist.org/projects/western-redcedar-dieback-map run here Licence: iNaturalist per-observation licences, mostly CC BY-NC (non-commercial) with about a third all rights reserved; Hulbert repository CC0; the park service names no licence. Statistics only, no record redistributed used in Data and provenance
- iNaturalist. Maple Health Watch, project 164816. Observations read through the public API on 29 October 2026. Per-observation licences, mostly CC BY-NC. run here Licence: iNaturalist per-observation licences, mostly CC BY-NC (non-commercial) with about a third all rights reserved; Hulbert repository CC0; the park service names no licence. Statistics only, no record redistributed used in Data and provenance
- Hulbert, J. M. Redcedar: data and analysis for the western redcedar dieback project. Public repository, CC0 1.0. https://github.com/jmhulbert/redcedar run here Licence: iNaturalist per-observation licences, mostly CC BY-NC (non-commercial) with about a third all rights reserved; Hulbert repository CC0; the park service names no licence. Statistics only, no record redistributed used in Data and provenance
- Green Seattle Partnership. Forest Monitoring: plots, visits and trees. Public feature service of the City of Seattle; no named licence. run here Licence: iNaturalist per-observation licences, mostly CC BY-NC (non-commercial) with about a third all rights reserved; Hulbert repository CC0; the park service names no licence. Statistics only, no record redistributed used in Data and provenance
- Washington Department of Natural Resources and partners (2022). Final report, August 2022, with a title beginning "Investigating the extent and possible causes of western"; the search result cut the title short. abstract or summary, 2026-11-14: search snippets; full text not read used in Introduction, Discussion
- Washington Department of Natural Resources and Oregon Department of Forestry (2022). Western redcedar dieback in the Northwest. Cooperative forest health alert, September 2022. abstract or summary, 2026-11-14: search snippets; full text not read used in Introduction, Discussion
- Washington State University graduate thesis. Title beginning "Hot, dry, then die: the future"; the record we hold cuts the title short. Research Exchange record 99900883438501842. abstract or summary, 2026-11-14: search snippets; full text not read used in Introduction
Cited by later findings
- No later record in the findings ledger treats this finding.
Reproduce
Data
- iNaturalist. Licence: iNaturalist per-observation licences, mostly CC BY-NC (non-commercial) with about a third all rights reserved; Hulbert repository CC0; the park service names no licence. Statistics only, no record redistributed. https://www.inaturalist.org/projects/western-redcedar-dieback-map
- iNaturalist. Licence: iNaturalist per-observation licences, mostly CC BY-NC (non-commercial) with about a third all rights reserved; Hulbert repository CC0; the park service names no licence. Statistics only, no record redistributed.
- Hulbert, J. Licence: iNaturalist per-observation licences, mostly CC BY-NC (non-commercial) with about a third all rights reserved; Hulbert repository CC0; the park service names no licence. Statistics only, no record redistributed. https://github.com/jmhulbert/redcedar
- Green Seattle Partnership. Licence: iNaturalist per-observation licences, mostly CC BY-NC (non-commercial) with about a third all rights reserved; Hulbert repository CC0; the park service names no licence. Statistics only, no record redistributed.
Preregistration
sha256 c7064ebb39decd2d892e6820af67d00a502160b5fe20addb9eb4c98a005d1624
plan 1acea23f395c37e4b73c5cf2ad61279adaf5e64cd41c313ccb9f1f8d8d07776e
Steps
- Data: iNaturalist projects Western Redcedar Dieback Map (project 88444, https://www.inaturalist.org/projects/western-redcedar-dieback-map) and Maple Health Watch (project 164816), per-observation licences, mostly CC BY-NC with about a third all rights reserved; the redcedar data folder at https://github.com/jmhulbert/redcedar (CC0 1.0); Green Seattle Partnership Forest Monitoring feature service (no named licence, City of Seattle disclaimer).
- Keep located, unobscured observations of each species. Code health and the four water measures as in the methods.
- Fit eq. 1 with a small ridge penalty (1e-4) and take a 1,000-draw cluster bootstrap over 5 km cells or plots.
- Compute eq. 2 over cells or parks, and repeat it on 1,000 within-site shuffles of the health labels.
- Compute the fill rates and the observer draws.
- Seed 20261029 (numpy generator, consumed in the preregistered order).
- Preregistration SHA-256: c7064ebb39decd2d892e6820af67d00a502160b5fe20addb9eb4c98a005d1624. Plan SHA-256: 1acea23f395c37e4b73c5cf2ad61279adaf5e64cd41c313ccb9f1f8d8d07776e. Run 20261029T150625Z.
Cost. About 13 seconds for the analysis and 47 seconds for the controls on one desktop computer. The study was not re-run for this paper.
Downloads
- Whitepaper, PDF F33.pdf, 483 KB
- BuildTeX source F33.bld, 31 KB
- Build receipt F33.buildtex.json, 1 KB
- BuildLang doc module doc.bld, 5 KB, imported by the source
The PDF is typeset by BuildTeX from F33.bld, which is written from the same source as this page. The receipt records the source's SHA-256 and the PDF's (7cc45d9baabc), so anyone can rebuild it and compare. The copy here has its hidden author field blanked, as the site does for every file it publishes; blank the same field in a rebuild before comparing. The name stays on the first page.
Verified
Verified on 2026-11-14. On 14 November 2026 every count, share, odds ratio, interval, shuffle percentile, fill rate and verdict rule in this paper was re-read from the run's result file, with odds ratios taken as exponentials of the stored log values. They match the findings ledgerDefinition: findings ledger our records The append-only, dated list of every result we have recorded, numbered F1, F2 and on. Corrections are added as new dated lines and old entries are never rewritten. Excludes a curated list of successes. full definition, our append-only dated list of recorded results. The preregistration's SHA-256 was recomputed from the locked file and matches the hash in the result file and the lock record. The priors, the definitions and the licence notes were read from the preregistration and the download record. Both figures were drawn by a script that reads only the result file.
Not checked. The study was not re-run for this paper. The licence terms of each iNaturalist observation and of the park service were not re-checked at their sources. The literature was found by two searches run on 14 November 2026 and read at the level of search snippets; the reports themselves were not opened.
Terms on this page
Each term is defined where it is first used on this page. Each name below opens its entry in the findings glossary, which lists every page that uses it.
- preregistration research method (metascience) first use
- verdict research method (our usage) first use
- community science ecology (data collection) first use
- odds ratio statistics first use
- logistic regression statistics first use
- 95% interval statistics first use
- cluster bootstrap statistics first use
- Mantel-Haenszel odds ratio epidemiology and statistics first use
- control statistics and experimental design first use
- null distribution statistics first use
- fill rate survey methods, our usage first use
- findings ledger our records first use
To report an error, name the finding, the claim number and the source on the Work page, which gives the address. Accepted corrections join the Trail with their date.