
Findings F32 Method and statistics, Psychology and perception found 2026-10-29
Forecasters who skip questions score better, and the best filter reads the probability
In 410,451 forecasts from the Good Judgment Project, a filter that holds back forecasts by their stated probability cut the average error far more than one that reads the forecaster's own expertise rating. People who skip more questions also score better on their first answers, though a person who skips more in one year is not clearly better for it.
- Tier
- B*, strong signal
- Outcome
- held
- Rung
- hypothesis
- Verdicts
- 5 passed, 5 failed
- Corrections
- 3, latest 2026-11-14
- Version
- v3, 2026-11-14
- Redo it
- Reproduce
Download PDF 622 KB BuildTeX source F32.bld
What this means for a reader
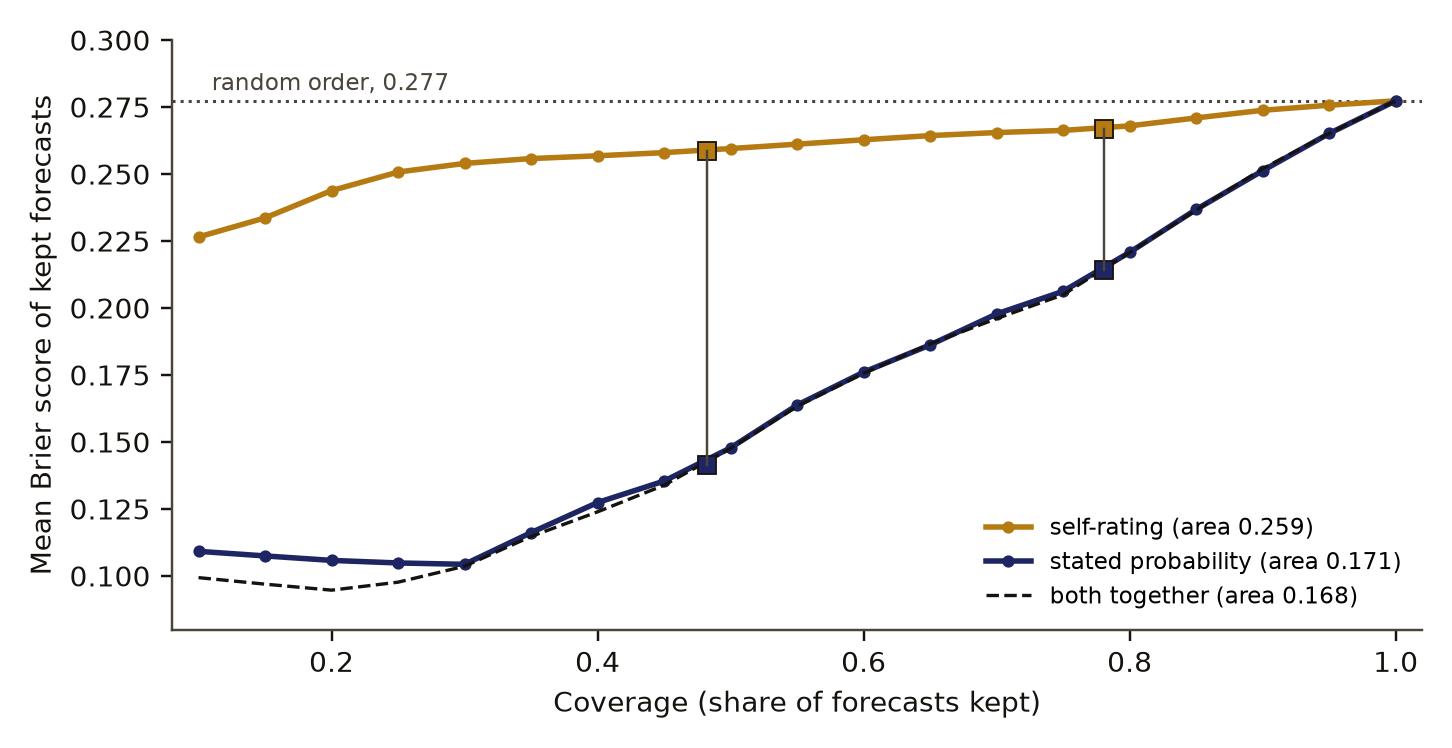
When a forecaster, a panel or a software system has to choose which answers to withhold, the number it already states is a much better guide than how expert it says it is. In a large public forecasting tournament, a filter on the stated probability cut the error of kept forecasts about six times as much as a filter on self-rated expertise, and the self-rating added nothing a shuffled rating did not also add. People who answer selectively are better forecasters on average, so a habit of skipping marks a careful source. The data does not show that skipping a question makes the remaining answers better.
Objection
Inferred skips may be questions a forecaster never saw; matched strata may explain any difference in sign from Merkle and colleagues, whose sign we have not confirmed; a filter on stated probability rewards confidence by construction.
What would change the call. Replicate on another tournament where question exposure is visible; read Merkle and colleagues in full.
From the strongest objection recorded in our publication register.
Abstract
A source that may decline to answer needs a rule for which answers to hold back. We tested two candidate inputs for that rule on the public survey forecasts of the Good Judgment Project: the probability the forecaster stated, and the forecaster's own 1 to 5 rating of their expertise on that forecast. On 410,451 binary forecasts, filters were scored by the area under the risk-coverage curve, the mean Brier score of kept forecasts as coverage falls from 100 to 10 percent. A filter on the stated probability scored 0.171, a filter on the self-rating 0.259, and random order 0.277. Adding the self-rating to the probability gained 0.0026 (95 percent interval 0.0007 to 0.0046), under the preregistered bar of 0.005, and a rating shuffled within each forecaster-year gained 0.0024 on average. We also asked whether people who skip questions forecast better. On first forecasts only, skip rate correlated with better relative Brier score at rho +0.286 (+0.264 to +0.303) across 9,204 forecaster-years, and +0.195 (+0.174 to +0.212) when timing was matched as well. Within the same person across consecutive years the correlation was +0.041 (-0.007 to +0.095) over 1,578 pairs, so no within-person benefit of skipping was shown. Forecasts rated expertise 1 are pulled toward 50 percent by about the right amount: the best extremising factor was 0.92 (0.79 to 1.06).
c1 observed, evidence for claim 1
- The numbers in claim 1
- 0.171; 0.259; 0.277 matches the result file, 2026-11-09
- Chart 1
- Error of the forecasts a filter keeps, as it keeps fewer of them.
- Basis
- observed: measured in this study, with a result file
c2 observed, evidence for claim 2
- The numbers in claim 2
- 0.0026; 95; 0.0007; 0.0046; 0.005; 0.0024 matches the result file, 2026-11-09
- Chart 2
- What the self-rating adds to the probability filter, against a shuffled rating and the bar.
- Basis
- observed: measured in this study, with a result file
c3 observed, evidence for claim 3
- The numbers in claim 3
- +0.286; +0.264; +0.303; 9,204; +0.195; +0.174; +0.212 matches the result file, 2026-11-09
- Chart 3
- Skipping and accuracy: across forecasters, and within the same person over time.
- Basis
- observed: measured in this study, with a result file
c4 observed, evidence for claim 4
- The numbers in claim 4
- +0.041; -0.007; +0.095; 1,578 matches the result file, 2026-11-09
- Chart 3
- Skipping and accuracy: across forecasters, and within the same person over time.
- Basis
- observed: measured in this study, with a result file
c5 observed, evidence for claim 5
- The numbers in claim 5
- 1; 50; 0.92; 0.79; 1.06 matches the result file, 2026-11-09
- Chart 4
- Best extremising factor by self-rated expertise.
- Basis
- observed: measured in this study, with a result file
Introduction and motivation
The Good Judgment Project ran from 2011 to 2015 as one of several research teams in a geopolitical forecasting tournament. Thousands of volunteers gave probabilities for world events, and the project tested training, teaming and tracking of top performers as ways to raise accuracy [2]. The survey forecasts, with each forecaster's self-rated expertise on each forecast for the first three years, are public.
Forecasters in the project chose which questions to answer. That choice is part of the data. Merkle, Steyvers, Mellers and Tetlock [3] asked whether good and poor forecasters choose questions differently, and whether those choices can sharpen estimates of a forecaster's ability beyond what a proper scoring ruleDefinition: proper scoring rule decision theory and forecast verification A score for probability forecasts on which a forecaster does best in expectation by stating their true belief. Excludes scores that pay for shading a forecast toward some answer, and any rule for which questions to answer. full definition reads from the forecasts alone. A proper scoring rule, in decision theory, is a score that a forecaster does best on in expectation by stating their true belief; a rule that pays for shading toward a favoured answer is not proper. Sempere and Lawsen [5] showed that a mean Brier scoreDefinition: Brier score forecast verification, from weather forecasting The squared difference between the stated probabilities and the outcomes, here summed over the answer options in the GJP form so it runs from 0 to 2. Lower is better. Excludes questions left unanswered, which it does not score. full definition gives a forecaster a reason to skip. The Brier score, from weather forecasting, is the squared difference between the stated probabilities and what happened, so lower is better; it scores each answer given and says nothing about questions left unanswered: a forecaster whose average Brier score is should not forecast any question whose true probability lies between and , even when they know it exactly. Skipping and scoring are therefore tangled before any data is read.
Machine learning has a matching problem under the name selective predictionDefinition: selective prediction machine learning Prediction with a reject option, where a system answers only the inputs it ranks most likely to be right and declines the rest. Excludes how the kept answers are produced. full definition. A classifier with a reject option keeps the inputs it is most confident on and declines the rest; the term covers that choice of what to answer and leaves out how the kept answers are made. Its quality is drawn as a risk-coverage curveDefinition: risk-coverage curve machine learning, selective prediction The error on kept items against the share kept. Here risk is the mean Brier score of kept forecasts and coverage the share kept. Excludes any score for the forecasts withheld. full definition, the error on kept inputs against the share kept [6]. Here risk is the mean Brier score of kept forecasts and coverage the share kept, so the curve says nothing about the forecasts withheld. We use the same curve to score abstain filters for human forecasts.
The third question concerns the hedge. An earlier round of this study found that a forecast a person rates as expertise 1 is worse than the same person's higher-rated forecasts and sits nearer 50 percent. ExtremisingDefinition: extremising forecast aggregation Pushing a probability away from 50 percent by multiplying its log-odds by a factor a, with a below 1 pulling it inward instead. Excludes changing which side a forecast leans to. full definition, the transformation Baron, Mellers and colleagues studied for aggregated forecasts [4], pushes a probability away from 50 percent by scaling its log-odds by a fixed factor, and a factor below 1 pulls it inward instead; it changes no forecast's direction. It can test whether that pull toward 50 percent is too large, too small or the right size.
The study was built to inform one design choice: how the abstain filter in Flywheel, our accountability software, should rank a source's answers. Should it credit a source for abstaining, and does it need the source's self-rating beside the stated probability?
Preregistration and design
This is the second round of the study. The preregistrationDefinition: preregistration research method (metascience) A dated written plan for a study, fixed and hash-locked before any result is seen: the question, the data, the statistic, the controls, the forecasts and the kill conditions. Excludes a plan revised after looking at the outcome, and a protocol written only for the record after the run. full definition, a practice from clinical trials and psychology in which a dated plan is fixed before results are seen, was written on 29 October 2026 after the first round's results and before any second-round statistic was computed on the real data, and it was hash-locked at 14:59:09 UTC that day. A plan revised after a look at second-round outcomes would not have counted as one. It lists what had been seen before it was written: the first round's results and structural counts of conditions, first forecasts and repeat forecasters taken from the survey files with no outcome joined.
The second-round code was checked first on synthetic files shaped like the GJP data, with planted effectsDefinition: planted check research method; called a positive control in experimental science Data built so that the right answer is known, run through the same analysis before the real data, to show that the analysis can see the effect when it is there. Excludes any check made on the real data, which cannot show what the analysis misses. full definition that the code recovered. That is a planted check: data built so the right answer is known, run through the same analysis before the real data, to show the analysis can find an effect when it is there, which no check on real data can show. That check showed that matching on the number of questions answered removes most of the variation in skip rate, because skip rate is one minus answered over available. Matching on forecast count therefore stayed the primary design, as in the first round. This is recorded in the preregistration.
The file names ten verdictsDefinition: verdict research method (our usage) The pass or fail of one preregistered rule set against the run's numbers, read off by code. Excludes an interpretation written after reading the numbers. full definition in four parts, each with rules that must all hold, seven shuffle controlsDefinition: control statistics and experimental design A version of the data with the structure under test removed (for example shuffled or pooled), scored the same way as the real data, so the real score has something to beat. Excludes a comparison with a different dataset or with a published number. full definition with their draw counts, a prior probability for each verdict, and a decision mapping from outcomes to the filter design. A verdict, in our usage, is the pass or fail of one such rule set read off by code, never a reading written after the numbers were seen. A control is a copy of the data with one link broken, by shuffling, and scored with the same code as the real data; a comparison with another dataset or a published number is not a control. Appendix A gives every verdict and its rule. Nothing was added after the run.
Data and provenance
The data are the Good Judgment Project survey forecasts for years 1 to 4 and the question file, published by Mellers and colleagues on the Harvard Dataverse (doi:10.7910/DVN/BPCDH5) under CC0 1.0Definition: CC0 1.0 copyright and data licensing The Creative Commons public domain dedication, under which anyone may reuse the work for any purpose without permission. Excludes a licence condition requiring citation, which stays a scholarly courtesy. full definition [1]. CC0 is the Creative Commons public domain dedication: anyone may reuse the data for any purpose without permission, and citation is a scholarly courtesy rather than a licence term. The person-level test file and the prediction-marketDefinition: prediction market economics and forecasting A market in which people trade contracts that pay on an outcome, with the price read as a probability. Excludes the individual survey forecasts analysed in this paper. full definition files in the same release were not used; in a prediction market people trade contracts that pay on an outcome and the price is read as a probability, which is a different instrument from the survey forecasts used here. The SHA-256Definition: SHA-256 cryptography A hash function that turns a file into a 64-character fingerprint which changes if any byte changes. A recorded hash shows the file was not altered after it was taken. Excludes encryption, because the hash keeps nothing secret and cannot be turned back into the file. full definition of each of the five input files was recorded before the run and matched after it. SHA-256 is a cryptographic hash, a 64-character fingerprint that changes if any byte of a file changes; it shows the files were not altered and keeps nothing secret.
The survey files hold 3,143,460 rows, one per answer option. Dropping 43,944 withdrawal rows left 1,234,940 forecasts. Of the 617 questions, 498 closed with an outcome and 119 were voidedDefinition: voided question the Good Judgment Project tournament A question the tournament cancelled without scoring, so no forecast on it has an outcome. Excludes a void verdict in our sense, which concerns a failed planted check or a sample below its minimum. full definition. A voided question is one the tournament cancelled without scoring, a tournament term with no bearing on the verdict sense of void. We dropped 157,189 forecasts on voided or unresolved questions, 13,381 dated after the question closed and 15 whose probabilities could not be repaired. That leaves 1,064,355 scored forecasts from 9,914 people, of which 414,570 are a person's first forecast on a question in a year.
Self-rated expertise, 1 to 5 on each forecast, exists in years 1 to 3 only; all 619,380 year 4 forecasts lack it. The abstain-filter sample is therefore every binary scored forecast in years 1 to 3 with a rating: 410,451 forecasts. Experimental conditions 1 and 2 are individuals, 4 teams and 5 superteamsDefinition: superteam the Good Judgment Project design A team made up of forecasters drawn from the top performers of the previous tournament year (condition 5). Excludes ordinary teams (condition 4), formed without selection on past accuracy. full definition. A superteam, in the project's design, is a team made up of forecasters drawn from the top performers of the previous year; ordinary teams were formed without that selection. The prediction-market condition is not in the survey files.
The data hold no record of a declined question. A skipDefinition: skip our usage A closed question that was open during a forecaster's active window in a year and that they never answered, inferred from the data. Excludes questions outside the active window, and any recorded decision to decline, which the data do not hold. full definition is inferred: a closed question that was open during a forecaster's active window in a year and that they never answered. The word is ours for that inferred absence, and it excludes questions that closed before or opened after the forecaster's active window. Only aggregates and distributions are reported here. No score for any named person was stored.
Methods
Scoring
Each forecast is scored with the Brier score in the GJP form, summed over the answer options, so that it runs from 0 to 2:
where is the stated probability of option and is 1 if that option occurred and 0 otherwise. The relative scoreDefinition: relative Brier score forecast verification, our usage A forecaster's mean, over the questions they answered, of their first-forecast Brier score minus the median first-forecast Brier score on that question. Lower is better. Excludes the difficulty of the question, which subtracting the median removes. full definition of forecaster on first forecasts is the mean, over the questions they answered, of their first-forecast Brier score minus the median first-forecast Brier score on that question. It is our measure of skill against the crowd on the same question, and it leaves out how hard the question was, which the median absorbs:
The time-matched version takes the median only over first forecasts made in the same tenth of the question's open period, drops cells with fewer than 5 first forecasts, and needs 5 or more valid questions per forecaster-yearDefinition: forecaster-year our usage One person's forecasts within one tournament year, the unit for skip rate and relative score. Excludes pooling of different people, and pooling one person's years. full definition, our unit of analysis: one person's forecasts within one tournament year, so a person active in three years counts three times and no two people are pooled. Lower is better, so the tests correlate skip rate with .
Skip rate and the matched correlation
A forecaster-year is eligible with at least 10 available questions and 5 answered. Its skip rate is
where is the number of available questions answered and the number available. Busy forecasters answer more, so the correlation is taken inside strataDefinition: stratum survey statistics A group of units alike on the matched variables, here year and twentieth of forecast count, inside which a statistic is computed before averaging. Excludes control for variables that were not matched. full definition of year and twentieth of forecast count, each with 10 or more forecaster-years, and averaged with weights equal to stratum size. A stratum, a term from survey statistics, is a group of units alike on the matched variables, so comparisons inside it cannot be driven by those variables; it does nothing about variables left unmatched:
where is the Spearman correlationDefinition: Spearman correlation (rho) rank statistics The correlation between the ranks of two quantities, from -1 to +1, which reads any steady rise or fall. Excludes the shape of the relation and the pull of outliers on the raw values. full definition of with inside stratum . Spearman's rho, from rank statistics, is the correlation of the ranks of two quantities, so it reads any steady rise or fall and ignores the shape of the relation and the size of outliers. IntervalsDefinition: 95% interval statistics The range that holds the middle 95 percent of the bootstrap or control draws for a number. We report it beside the number. Excludes a statement that the true value lies inside with 95 percent probability. full definition come from 1,000 bootstrapDefinition: bootstrap statistics Recomputing a number many times on data resampled with replacement, here within strata or over questions, to see how much it varies. Excludes an interval from a textbook formula that assumes a distribution. full definition draws within strata. Each 95 percent interval is the range holding the middle 95 percent of the draws, and it is no statement that the true value lies inside with 95 percent probability. The bootstrap, a resampling method from statistics, recomputes the number on data resampled with replacement and assumes no textbook distribution.
The within-person test takes pairs of consecutive years in which a person kept the same majority condition. Inside each year pair it computes the Spearman correlation of the change in skip rate with the change in time-matched score, and averages over year pairs weighted by pair count. Changing condition between years would change the platform and the questions, so mixed pairs are left out of the primary test.
The size of the hedge
For a stated probability the extremised probability is
so the log-oddsDefinition: log-odds statistics For a probability p, the natural log of p divided by 1 minus p. 0 at 50 percent and unbounded toward certainty. Excludes any information beyond the probability, of which it is a rescaling. full definition are multiplied by . The log-odds of a probability , a term from statistics, is , which is 0 at 50 percent and grows without bound toward certainty; it is a rescaling of the probability and adds no information to it. A value above 1 means forecasts were too hedged, below 1 too extreme, and 1 right-sized. The factor is fitted by minimum Brier score on a grid from 0.30 to 4.00 in steps of 0.01. Questions were split once at random into two halves; the held-out gainDefinition: held-out gain machine learning The drop in Brier score from extremising, with the factor fitted on one half of the questions and scored on the other half. Excludes the in-sample improvement any fitted factor gives on the data it was fitted to. full definition is the Brier score at minus the Brier score at the fitted on the other half, summed over both halves and taken per forecast. Held-out, in machine-learning usage, means scored on data the fit never saw, which excludes the in-sample improvement any fitted factor gives. The primary contrast uses the first round's within-person sample: forecaster-years with at least 5 forecasts at expertise 1 and 5 at expertise 2 to 5. Intervals come from 1,000 bootstrap draws over questions.
Abstain filters
A filter ranks forecasts by predicted Brier score and keeps the best-ranked share , the coverage. Its risk is the mean raw Brier score of the kept forecasts. Each predictor is an out-of-foldDefinition: out-of-fold prediction machine learning, cross-validation A prediction for each item made from a fit on the other folds only. Excludes any use of the item's own outcome to predict it. full definition cell mean, computed for each forecast from the other folds only, so no forecast helps predict itself: the self-rating filter uses the five expertise levels, the probability filter ten bins of distance from 0.5 in steps of 0.05, and the combined filter their 50 crossed cells, falling back to the probability bin where a cell has fewer than 30 training forecasts. Ties are broken by one fixed random key. The summary is the area under the risk-coverage curveDefinition: area under the risk-coverage curve machine learning, selective prediction The mean risk over coverages from 10 to 100 percent in steps of 5, one number for a whole filter. Lower is better. Excludes coverages below 10 percent. full definition, taken as the mean risk over 19 coverages. The area is a selective-prediction summary of a whole filter in one number, lower being better, and it excludes coverages below 10 percent:
with running from 1 to 19 and , so coverage runs from 0.10 to 1.00. Lower is better. A random filter keeps the overall mean at every coverage.
Controls and p values
Every shuffle control is scored with the same code as the real data. The p valueDefinition: p value (from draws) statistics The share of control draws scoring at or above the real score, with one added to the count and to the number of draws, so it is never zero. Excludes a p value from a textbook formula that assumes a distribution. full definition of a comparison, a p value from draws as in permutation statistics, assumes no textbook distribution and counts the control draws at or above the real value, with one added to the numerator and the denominator:
where is the number of draws at or above the real value and the number of draws. At 1,000 draws the smallest possible value is 0.001.
Controls and planted checks
Seven controls were fixed in the preregistration. Each breaks one link and keeps the rest of the data. The scores a control gives over its draws form a null distribution, whose 95th percentile is the bar a real score must clear; it is drawn from these data, never assumed from theory.
- Skip rate shuffled within year and forecast-count strata, the nullDefinition: null distribution statistics The spread of scores a control gives over many random draws. Its 95th percentile is the bar a real score must clear. Excludes a theoretical distribution assumed rather than drawn from the data. full definition for the first-forecast correlation (1,000 draws), and the same on the time-matched table (1,000).
- Change in skip rate shuffled within year pair, the null for the within-person test (1,000).
- The expertise-1 label shuffled within forecaster-year with the question halves fixed, the null for the difference in extremising gain (300).
- Expertise shuffled within forecaster-year with all predictors refitted, the null for the gain from adding the rating to the probability filter (300). This asks whether the rating carries information about one forecast or only about who is rating.
- The team label shuffled across forecaster-years within year, the null for the team-against-individual differences in skip effect and in filter gain (300 each).
The random filter is the known floor: Brier 0.277 at every coverage. Before the real data were read, the code recovered planted effects in synthetic files of the same shape: skippers sharper on first forecasts, a within-person change, and over-hedged expertise-1 forecasts. The first round also carried a positive controlDefinition: positive control experimental design A test of an effect already known to be present, which the instrument must detect for its other readings to be trusted. Excludes a shuffle control, which removes an effect instead. full definition that passed, a test of an effect already known to be there, which the instrument must detect for its other readings to be trusted: one point of self-rated expertise improved relative Brier by 0.0226 (0.0185 to 0.0270) within forecaster-years, against a shuffle 95th percentile of 0.0015. Every control in this round had enough spread to be usable.
Results
Abstain filters
Figure 1 draws the three risk-coverage curves and Table 1 gives their areas. A filter on the stated probability scored 0.171, a filter on the self-rating 0.259, and random order 0.277. The probability filter gains 0.107 (0.097 to 0.115) over random, and the self-rating filter 0.018 (0.009 to 0.027), about a sixth as much.
mean Brier score of kept forecasts (lower is more accurate)
share of forecasts kept (percent); the filter withholds more toward the left
- Filter on the stated probability
- Filter on self-rated expertise
- Filter on both together
- random order, 0.277
Data behind chart 1 20 rows
| Share kept | Stated probability | Self-rated expertise | Both | Random order |
|---|---|---|---|---|
| 10% | 0.109 | 0.227 | 0.099 | 0.277 |
| 15% | 0.107 | 0.234 | 0.097 | 0.277 |
| 20% | 0.106 | 0.244 | 0.095 | 0.277 |
| 25% | 0.105 | 0.251 | 0.098 | 0.277 |
| 30% | 0.104 | 0.254 | 0.104 | 0.277 |
| 35% | 0.116 | 0.256 | 0.115 | 0.277 |
| 40% | 0.127 | 0.257 | 0.124 | 0.277 |
| 45% | 0.135 | 0.258 | 0.134 | 0.277 |
| 50% | 0.148 | 0.260 | 0.148 | 0.277 |
| 55% | 0.164 | 0.261 | 0.163 | 0.277 |
| 60% | 0.176 | 0.263 | 0.176 | 0.277 |
| 65% | 0.186 | 0.264 | 0.187 | 0.277 |
| 70% | 0.198 | 0.266 | 0.196 | 0.277 |
| 75% | 0.206 | 0.266 | 0.205 | 0.277 |
| 80% | 0.221 | 0.268 | 0.221 | 0.277 |
| 85% | 0.237 | 0.271 | 0.237 | 0.277 |
| 90% | 0.251 | 0.274 | 0.252 | 0.277 |
| 95% | 0.265 | 0.276 | 0.265 | 0.277 |
| 100% | 0.277 | 0.277 | 0.277 | 0.277 |
| Area (mean of the rows) | 0.171 | 0.259 | 0.168 | 0.277 |
Read from result.json (round 2 run), run 20261029T145914Z. SHA-256 of the run's file 7ef5c7a311de888a31ef904f8355a32eb01dd07b2fb9940ab0e88381a129a2e9 and of the published copy e0357998d9de055202383f630253f0993cb93bc82bbd707c246e1dbe2d85c393. In the copy, file paths are cut to the file name and the layout (indentation, line endings) may differ; every value is the same.
Adding the self-rating to the probability gained 0.0026 (95 percent interval 0.0007 to 0.0046), under the preregistered bar of 0.005, and a rating shuffled within each forecaster-year gained 0.0024 on average. The interval excludes zero, so the combined filter is better than the probability alone by a small amount. The shuffle buys nearly all of it: the small edge comes from who rates themselves high on average. The rating given to one forecast adds nothing past that. The combined filter leads by 0.007 to 0.011 in Brier score up to coverage 0.25, and by 0.004 or less above that. Relative Brier gives the same order: areas 0.124 for self-rating, 0.063 for probability, 0.061 for both and 0.134 for random.
drop in area when the rating is added (higher is a larger gain)
- Real self-rating added
- Shuffled rating added (control)
- 95% bootstrap interval over questions for the real rating; 5th to 95th percentile of the shuffles for the control
- bar set in advance, 0.005
Data behind chart 2 4 rows
| Rating added | Gain | Low | High | Range is |
|---|---|---|---|---|
| Real self-rating | 0.0026 | 0.0007 | 0.0046 | 95% bootstrap interval |
| Shuffled within forecaster-year | 0.0024 | 0.0020 | 0.0030 | 5th to 95th percentile of 300 shuffles |
| Self-rating filter over random order | 0.018 | 0.009 | 0.027 | 95% bootstrap interval |
| Probability filter over random order | 0.107 | 0.097 | 0.115 | 95% bootstrap interval |
Read from result.json (round 2 run), run 20261029T145914Z. SHA-256 of the run's file 7ef5c7a311de888a31ef904f8355a32eb01dd07b2fb9940ab0e88381a129a2e9 and of the published copy e0357998d9de055202383f630253f0993cb93bc82bbd707c246e1dbe2d85c393. In the copy, file paths are cut to the file name and the layout (indentation, line endings) may differ; every value is the same.
The by-hand rules lose to the probability filter at the same coverage. Withholding every expertise-1 forecast keeps 78 percent of forecasts at Brier 0.267; the probability filter at that coverage reaches 0.214 and the combined filter 0.214. Withholding expertise 1 and 2 keeps 48 percent at 0.259, against 0.141 for the probability filter and 0.142 combined.
Skipping and first forecasts
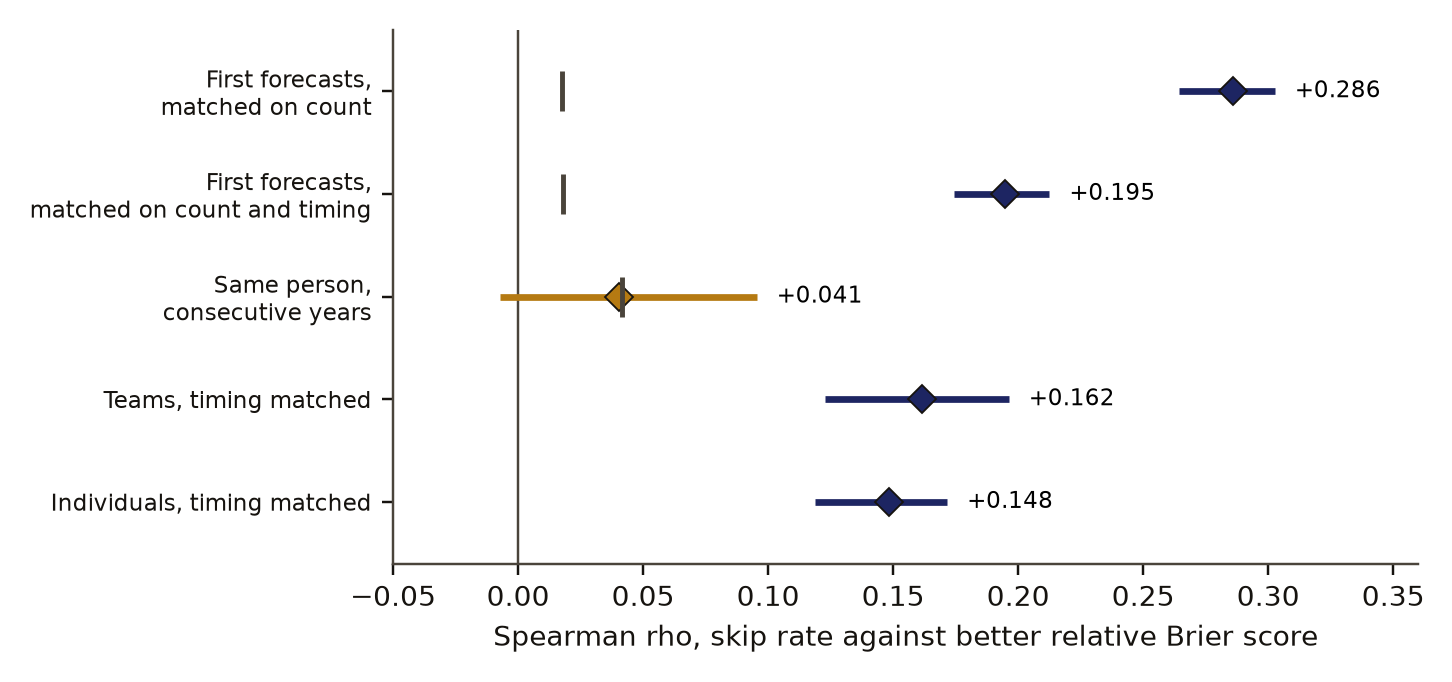
Figure 2 and Table 2 give the skip correlations. Across the 9,204 eligible forecaster-years (1,781; 1,114; 1,360 and 4,949 in years 1 to 4), the median skip rate was 0.59. On first forecasts only, skip rate correlated with better relative Brier score at rho +0.286 (+0.264 to +0.303) across 9,204 forecaster-years, and +0.195 (+0.174 to +0.212) when timing was matched as well. The first round's statistic on all forecasts, updates included, recomputed on the same table, was +0.351, so removing every update keeps about 80 percent of it.
rank correlation, rho (above 0: more skipping goes with better accuracy)
- Correlation between skipping and accuracy
- 95% bootstrap interval
- no relation
Data behind chart 3 3 rows
| Comparison | rho | 95% low | 95% high | Shuffle 95th pct | Shuffle p | n |
|---|---|---|---|---|---|---|
| Across forecasters, one point per forecaster-year: Skip rate and accuracy, first forecasts | +0.286 | +0.264 | +0.303 | 0.018 | 0.0010 | 9,204 forecaster-years |
| Across forecasters, one point per forecaster-year: Same, with timing matched | +0.195 | +0.174 | +0.212 | 0.018 | 0.0010 | 9,204 forecaster-years |
| Within one person, change between consecutive years: Change in skip rate and change in accuracy | +0.041 | −0.007 | +0.095 | 0.041 | 0.055 | 1,578 year pairs |
Read from result.json (round 2 run), run 20261029T145914Z. SHA-256 of the run's file 7ef5c7a311de888a31ef904f8355a32eb01dd07b2fb9940ab0e88381a129a2e9 and of the published copy e0357998d9de055202383f630253f0993cb93bc82bbd707c246e1dbe2d85c393. In the copy, file paths are cut to the file name and the layout (indentation, line endings) may differ; every value is the same.
Skippers enter questions later. Inside strata, skip rate correlates +0.41 with the mean timing of a person's first forecasts, and matching on timing removes about a third of the first-forecast effect. Inside the same strata skip rate also correlates +0.452 with updates per answered question, and updates per question correlate +0.178 with better first-forecast score: people who update a lot also make better first forecasts.
Within the same person across consecutive years the correlation was +0.041 (-0.007 to +0.095) over 1,578 pairs, so no within-person benefit of skipping was shown. The pairs split 501, 469 and 608 across years 1 to 2, 2 to 3 and 3 to 4. The estimate sits just under the shuffle's 95th percentile of +0.041 (p 0.055). The test had room to see an effect of cross-sectional size: test-retest correlationDefinition: test-retest correlation psychometrics The correlation between one person's value in one year and the same person's value in the next, a measure of how stable the quantity is. Excludes change caused by anything the person did between the two years. full definition, the psychometric term for how well one person's value in one year predicts the same person's value the next, is 0.62 for skip rate and 0.46 for score, skip rate changed by a standard deviation of 0.25 between years, and the upper bound of +0.095 is under half the time-matched cross-section. All 1,962 pairs, mixed conditions included, give +0.031 (-0.013 to +0.075).
Teams skip more than individuals (median skip rate 0.63 against 0.57), but the skip effect did not differ detectably: the gap of 0.013 sits under the label-shuffle 95th percentile of 0.043. Superteams removed, condition 4 alone gives +0.154. The gain from adding the self-rating to the filter was 0.0033 in teams and 0.0008 for individuals, a gap of 0.0025 against a shuffle 95th percentile of 0.0030 (p 0.11).
The size of the hedge
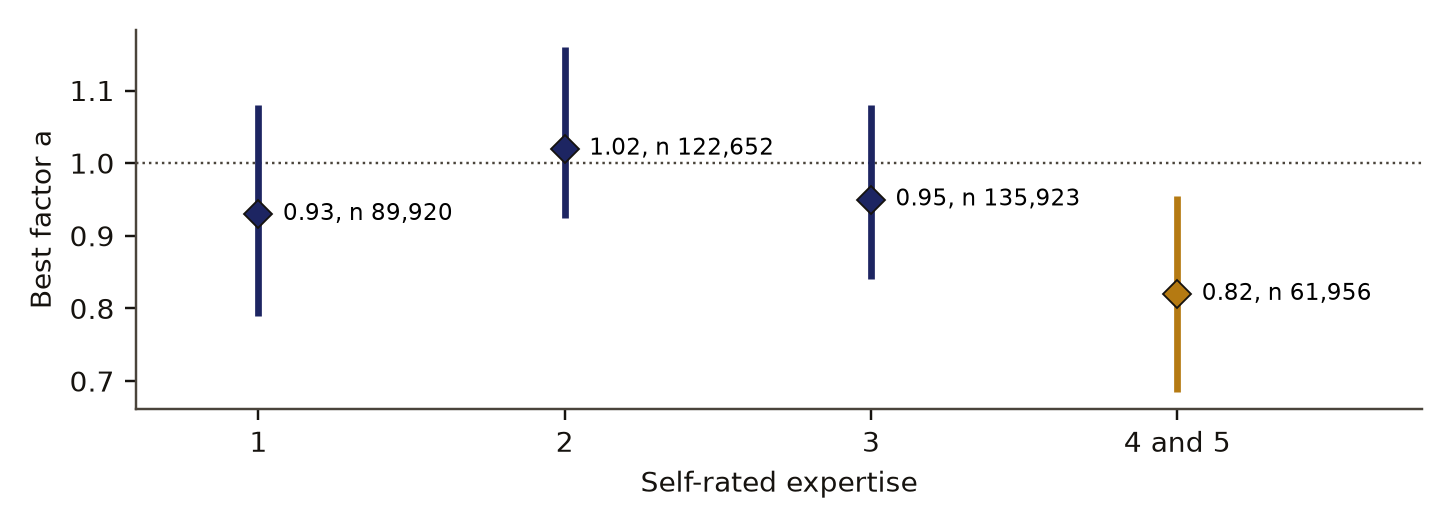
In the within-person sample (1,826 forecaster-years; 77,572 forecasts rated 1 and 165,914 rated 2 to 5), forecasts rated expertise 1 are pulled toward 50 percent by about the right amount: the best extremising factor was 0.92 (0.79 to 1.06). The held-out gain from extremising them was +0.0002 (-0.0010 to +0.0016). Forecasts rated 2 to 5 gave 0.93 (0.81 to 1.04), a difference of -0.01 (-0.09 to +0.08). Extremising helped neither group: the gain for low-rated forecasts minus the gain for high-rated ones was -0.0001 (-0.0009 to +0.0008). Table 3 shows the folded calibration behind these numbers.
best extremising factor (1 is right-sized; below 1 is too extreme)
- Best extremising factor
- 95% bootstrap interval over questions
- 1, right-sized as stated
Data behind chart 4 6 rows
| Forecasts | Best factor | 95% low | 95% high | Forecasts counted |
|---|---|---|---|---|
| Within-person sample (the tested comparison): Rated expertise 1 | 0.92 | 0.79 | 1.06 | 77,572 |
| Within-person sample (the tested comparison): Rated expertise 2 to 5 | 0.93 | 0.81 | 1.04 | 165,914 |
| All forecasts in years 1 to 3, by rating level: Rated 1 | 0.93 | 0.79 | 1.08 | 89,920 |
| All forecasts in years 1 to 3, by rating level: Rated 2 | 1.02 | 0.92 | 1.16 | 122,652 |
| All forecasts in years 1 to 3, by rating level: Rated 3 | 0.95 | 0.84 | 1.08 | 135,923 |
| All forecasts in years 1 to 3, by rating level: Rated 4-5 | 0.82 | 0.68 | 0.96 | 61,956 |
Read from result.json (round 2 run), run 20261029T145914Z. SHA-256 of the run's file 7ef5c7a311de888a31ef904f8355a32eb01dd07b2fb9940ab0e88381a129a2e9 and of the published copy e0357998d9de055202383f630253f0993cb93bc82bbd707c246e1dbe2d85c393. In the copy, file paths are cut to the file name and the layout (indentation, line endings) may differ; every value is the same.
Folded expected calibration errorDefinition: expected calibration error forecast verification and machine learning The gap between stated probability and hit rate, averaged over probability bins and weighted by bin size. Folded here by taking each forecast on the side it leans to. Excludes how informative forecasts are, since a forecast of the base rate every time can score zero. full definition was 0.024 for low-rated and 0.021 for high-rated forecasts; 4,704 low-rated and 3,334 high-rated forecasts sat at exactly 0.5. Expected calibration error, a forecasting and machine-learning measure, is the gap between stated probability and hit rate averaged over the bins of Table 3, weighted by bin size; it measures whether forecasts mean what they say and is silent on how informative they are. Across all binary forecasts in years 1 to 3, with people pooled, Figure 3 gives the factor by level. Only the top of the scale misses: forecasts rated 4 or 5 were over-extreme, with a factor of 0.82 (0.68 to 0.96), and at stated probabilities from 0.6 to 0.9 their hit rate ran 0.04 to 0.06 under what they stated.
Discussion
The filter result has a plain mechanism. A forecast near 0 or 1 scores well when it is right, and calibrated forecasters are right about as often as they say. Ranking by stated probability therefore keeps the forecasts that will score best, and part of the gain is arithmetic: the filter rewards confidence by construction. This is the same arithmetic Sempere and Lawsen [5] point to when they show that a mean Brier score pays a forecaster to skip questions in the middle of the probability range. For a filter that only needs to lower the error of what it emits, the arithmetic is the point. For a claim that confident forecasters know more, it is not evidence.
The self-rating adds little because the stated probability already carries it. The first round read "worse and nearer 0.5" as the rating carrying information past the probability. The hedge results settle that point. Expertise-1 forecasts are pulled toward 50 percent by the amount their information warrants, and their worse Brier score is what a calibrated, less informed forecast scores. Once a filter sees the probability, the per-forecast rating adds nothing a within-person shuffle does not also add. The one place the rating says something the probability does not is at the top: forecasters who rate themselves 4 or 5 are over-extreme, so a top rating works as a warning sign for overconfidence.
On skipping, the data separate a trait from an act. People who habitually answer selectively score better on their first forecasts, before any update, at matched timing, in teams and individuals alike. A person who skips more this year than last does not clearly gain from it. Skip rate works as a marker of a careful forecaster; the data do not show that abstaining improves an answer. Merkle and colleagues [3] asked whether good and poor forecasters select questions differently in the same tournament. An earlier search note of ours recorded that they found good forecasters selecting more questions, a sign that runs against ours before matching. We read their abstract only, so we cannot confirm the sign or say whether our forecast-count strata, which compare people of equal activity, account for the difference.
For the filter design, the decision mapping fixed in advance gives a direct reading. The filter ranks by stated probability. It does not take the self-rating as an add-on; a high self-rating is at most a flag to soften a forecast. A habit of abstaining can raise the weight given to a source, but abstention is not credited as something that improves an answer. One setting serves teams and individuals. All of this is human data. For model sources it sets the design to test, not the setting: a model's stated probabilities need their own check against outcomes.
Limitations
- Skips are inferred. A question counted as skipped may have been unseen, or outside the forecaster's condition; "available" is any closed question open during their active window.
- Nothing here is causal. People chose their ratings, their questions and when to forecast.
- The within-person interval reaches +0.095, which leaves room for a small benefit of skipping. Between years the platform, the question mix and the training also changed; same-condition pairs only reduce this.
- Updating, timing and selection remain tangled in the cross-section: skip rate correlates +0.452 with updates per question inside strata.
- A probability filter lowers Brier partly by arithmetic, as the discussion sets out.
- The filters were simulated after the fact on forecasts people chose to make with no filter in place. A live filter would change behaviour.
- Year 4 has no self-ratings, prediction-market trades were not used, and nothing here speaks for language models.
- Merkle and colleagues studied question selection in the same tournament and may disagree on the sign; we read only their abstract.
- Scoring was done by our own code and was not blind.
Evidence
Held. Large real data with working shuffle controls and a preregistration. Skips are inferred and causation is open, and a filter on stated probability lowers the Brier score partly by arithmetic. Merkle and colleagues (2017) is close prior work on selection.
Figures
These are the paper's own figures, numbered as in the PDF, and each "Figure" reference in the text points here. The charts on this page redraw the same results from the result files and carry their own numbers.
Tables
| Filter | Area | Gain and interval |
|---|---|---|
| Random order | 0.277 | reference |
| Self-rated expertise | 0.259 | 0.018 over random (0.009 to 0.027) |
| Stated probability | 0.171 | 0.107 over random (0.097 to 0.115) |
| Both together | 0.168 | 0.0026 over probability (0.0007 to 0.0046) |
| Both, rating shuffled within forecaster-year | not reported | 0.0024 over probability on average; 95th percentile 0.0030; p 0.31 |
| Test | rho | 95 percent interval | Shuffle | p |
|---|---|---|---|---|
| First forecasts, 9,204 forecaster-years | +0.286 | +0.264 to +0.303 | +0.018 | 0.001 |
| First forecasts, timing matched | +0.195 | +0.174 to +0.212 | +0.018 | 0.001 |
| Same person, 1,578 pairs | +0.041 | -0.007 to +0.095 | +0.041 | 0.055 |
| Teams, timing matched, 3,248 | +0.162 | +0.123 to +0.196 | none | none |
| Individuals, timing matched, 5,956 | +0.148 | +0.119 to +0.172 | none | none |
| Stated | Rated 1, n | Stated | Hit rate | Rated 2 to 5, n | Stated | Hit rate |
|---|---|---|---|---|---|---|
| 0.5 to 0.6 | 4,664 | 0.546 | 0.553 | 6,968 | 0.549 | 0.537 |
| 0.6 to 0.7 | 12,332 | 0.624 | 0.618 | 22,097 | 0.626 | 0.602 |
| 0.7 to 0.8 | 12,558 | 0.727 | 0.710 | 25,197 | 0.728 | 0.713 |
| 0.8 to 0.9 | 13,360 | 0.826 | 0.821 | 29,612 | 0.827 | 0.822 |
| 0.9 to 1.0 | 29,954 | 0.957 | 0.911 | 78,706 | 0.959 | 0.930 |
Appendix A. The preregistered verdicts
Each verdict is a set of rules written before the run, with the prior probability of a pass stated in the same file. A verdict passes only when every rule holds. Values are read from the run's result file.
| Verdict | Deciding rules | Value | Prior | Holds |
|---|---|---|---|---|
| First forecasts | rho at least 0.05; lower bound above 0; above shuffle 95th percentile (0.018) | +0.286; +0.264 | 0.6 | pass |
| Timing matched | the same three rules on the time-matched table (shuffle 0.018) | +0.195; +0.174 | 0.5 | pass |
| Same person | above 0; lower bound above 0; above shuffle 95th percentile (0.041) | +0.041; -0.007 | 0.3 | fail |
| Hedge right-sized | interval of a for expertise 1 contains 1; held-out gain under 0.002 | 0.79 to 1.06; 0.0002 | 0.3 | pass |
| Same correction | interval of the difference in a contains 0 | -0.09 to +0.08 | 0.4 | pass |
| Low-rated gain more | gain difference above 0; lower bound above 0; above shuffle 95th percentile (0.0002) | -0.0001 | 0.35 | fail |
| Rating beats random | gain over random above 0; lower bound above 0 | 0.018; 0.009 | 0.9 | pass |
| Rating adds to probability | gain at least 0.005; lower bound above 0; above shuffle 95th percentile (0.0030) | 0.0026; 0.0007 | 0.35 | fail |
| Teams differ on skipping | gap above label-shuffle 95th percentile (0.043) | 0.013 | 0.35 | fail |
| Teams differ on the filter | gap above label-shuffle 95th percentile (0.0030) | 0.0025 | 0.25 | fail |
Numbers recorded in our publication register
| What | Value |
|---|---|
| Sample | 410,451 binary forecasts; 1,578 same-condition pairs |
| Main estimate and interval | first rho +0.286 (+0.264, +0.303); timed +0.195 (+0.174, +0.212); within +0.041 (-0.007, +0.095) |
| Forecast against outcome | Passed: skip rate tracks first-forecast score across people, with and without timing matched. Failed: the within-person version, the combined filter beating the probability filter by the bar, and the two team-level forecasts |
| Known-answer check | a random filter has area 0.277 |
As recorded in the publication register, the summary row each finding gets; the paper's own numbers above were re-read from the result files.
What lowers it
- blinding Not blind: the analyst saw the data's shape before the lock. from our publication register, on blinding
- novelty Nearby work exists; novelty is not shown. from our publication register, on the literature
- depth of reading The cited literature was read at the level of abstracts, publisher pages and search summaries; full texts were not read. from the Verified section
What holds it up
- scoring Scored by code against rules fixed in advance. from our publication register, on who scored it
- preregistration Preregistered and hash-locked before the run (sha256 be6f2c1a). from the Reproduce section
- control Controls: the shuffles worked; a rating shuffled within each person gains 0.0024. from our publication register, on controls
- open data Public data. from our publication register, on the data licence
Where the claim stands
- lead
- hypothesis
- thesis
- conjecture
- theorem
- law candidate
- killed
A preregistration with pass-or-fail rules is on file, which this rung needs. The next rung needs a named rival reading beaten by a decisive observation, and none is on file. Tier B*: Large real data with working shuffle controls and a preregistration. Skips are inferred and causation is open, and a filter on stated probability lowers the Brier score partly by arithmetic. Merkle and colleagues (2017) is close prior work on selection.
Trail
Versions
- v3 2026-11-14, this page corrected, 1 item; the PDF and its BuildTeX source are still paper version 1.0
- v2 2026-11-09, paper version 1.0, first published PDF sha256 097c91b8868a3fe7
- v1 2026-10-29, entered in the findings ledger
Corrections
2026-11-14 scope found by a review of the published pages
A review of the published page found one sentence that the result file contradicts. now The results section said the combined filter leads only below coverage 0.30; in the file it is ahead at most coverage levels, by 0.007 to 0.011 up to coverage 0.25 and by 0.004 or less above that. The sentence now gives those sizes.
2026-11-09 wording found by the publication pass
The ledger entry read Merkle and colleagues (2017) as finding the opposite sign: good forecasters select more questions. now The abstract we read does not state that sign, so the reading is unconfirmed until the full paper is read. The paper and this page say so.
2026-10-29 scope found by the study itself, before publication
This round narrows the first round's reading. now The first round took the low-rating hedge as the self-rating carrying information past the stated probability; this round shows the probability already carries it.
Each correction is a dated note; the findings ledger is never rewritten, and a note governs where it differs.
Ledger and version dates up to publication are local dates in US Pacific time. Clock times in the text are UTC, seven or eight hours ahead, so a lock or a run stamped just after midnight UTC belongs to the previous local day. Corrections from 14 November 2026 on are dated in UTC.
References
- Mellers, B. and others. Good Judgment Project data: survey forecasts, years 1 to 4, and question file. Harvard Dataverse, CC0 1.0. doi:10.7910/DVN/BPCDH5 run here Licence: CC0, Dataverse BPCDH5; cite Mellers used in Data and provenance
- Mellers, B., Ungar, L., Baron, J., Ramos, J., Gurcay, B., Fincher, K., Scott, S. E., Moore, D., Atanasov, P., Swift, S. A., Murray, T., Stone, E. and Tetlock, P. E. (2014). Psychological strategies for winning a geopolitical forecasting tournament. Psychological Science 25(5), 1106-1115. doi:10.1177/0956797614524255 abstract or summary, 2026-11-09: abstracts, publisher pages and search summaries; full text not read used in Introduction and motivation
- Merkle, E. C., Steyvers, M., Mellers, B. and Tetlock, P. E. (2017). A neglected dimension of good forecasting judgment: the questions we choose also matter. International Journal of Forecasting 33(4), 817-832. doi:10.1016/j.ijforecast.2017.04.002 abstract or summary, 2026-11-09: abstracts, publisher pages and search summaries; full text not read used in Introduction and motivation, Discussion
- Baron, J., Mellers, B. A., Tetlock, P. E., Stone, E. and Ungar, L. H. (2014). Two reasons to make aggregated probability forecasts more extreme. Decision Analysis 11(2), 133-145. doi:10.1287/deca.2014.0293 abstract or summary, 2026-11-09: abstracts, publisher pages and search summaries; full text not read used in Introduction and motivation
- Sempere, N. and Lawsen, A. (2021). Alignment problems with current forecasting platforms. arXiv:2106.11248 abstract or summary, 2026-11-09: abstracts, publisher pages and search summaries; full text not read used in Introduction and motivation, Discussion
- Geifman, Y. and El-Yaniv, R. (2017). Selective classification for deep neural networks. Advances in Neural Information Processing Systems 30. arXiv:1705.08500 abstract or summary, 2026-11-09: abstracts, publisher pages and search summaries; full text not read used in Introduction and motivation
Cited by later findings
- No later record in the findings ledger treats this finding.
Reproduce
Data
- Mellers, B. Licence: CC0, Dataverse BPCDH5; cite Mellers. https://doi.org/10.7910/DVN/BPCDH5
Preregistration
sha256 be6f2c1a7f6125174f7a03de47baecc080af36002f4a8961ae5077b289084108
plan 94c658be401adce1a2687fafaab7d1bbae2ff0820a3b4e95d256f011f065ea5f
Steps
- Data: download the GJP survey forecasts (years 1 to 4) and the question file from the Harvard Dataverse, doi:10.7910/DVN/BPCDH5.
- Drop withdrawals, forecasts on voided or unresolved questions, forecasts dated after close and unrepairable probabilities. Score each forecast with eq. 1.
- For each forecaster-year with at least 10 available and 5 answered questions, compute the skip rate (eq. 3) and the first-forecast relative score (eq. 2), plain and time-matched. Take the matched correlation (eq. 4) inside year and forecast-count strata, and the within-person version on same-condition consecutive-year pairs.
- Fit the extremising factor (eq. 5) by grid search with a random split of questions into halves.
- Rank binary forecasts from years 1 to 3 by out-of-fold predicted Brier from self-rating, probability bin and both, and take the area (eq. 6). Shuffle the rating within forecaster-year and refit as the control.
- Seed 2026102902 (numpy generator, consumed in the preregistered order).
- Preregistration SHA-256: be6f2c1a7f6125174f7a03de47baecc080af36002f4a8961ae5077b289084108. Plan SHA-256: 94c658be401adce1a2687fafaab7d1bbae2ff0820a3b4e95d256f011f065ea5f. Result file SHA-256: 7ef5c7a311de888a31ef904f8355a32eb01dd07b2fb9940ab0e88381a129a2e9. Run 20261029T145914Z.
Cost. 5 minutes 22 seconds of wall time on one desktop computer, controls included. The study was not re-run for this paper.
Downloads
- Whitepaper, PDF F32.pdf, 622 KB
- BuildTeX source F32.bld, 49 KB
- Build receipt F32.buildtex.json, 1 KB
- BuildLang doc module doc.bld, 5 KB, imported by the source
The PDF is typeset by BuildTeX from F32.bld, which is written from the same source as this page. The receipt records the source's SHA-256 and the PDF's (097c91b8868a), so anyone can rebuild it and compare. The copy here has its hidden author field blanked, as the site does for every file it publishes; blank the same field in a rebuild before comparing. The name stays on the first page.
Verified
Verified on 2026-11-09. On 9 November 2026 every count, correlation, interval, extremising factor, held-out gain, calibration bin, filter area, operating point, shuffle mean, percentile and p value in this paper was re-read from the run's result file and the study's results text; every value the findings ledgerDefinition: findings ledger our records The append-only, dated list of every result we have recorded, numbered F1, F2 and on. Corrections are added as new dated lines and old entries are never rewritten. Excludes a curated list of successes. full definition also quotes matches it. The ledger is our append-only, dated list of every recorded result; corrections enter it as new lines and old entries are never rewritten. The preregistration's SHA-256 was recomputed from the locked file and matches the hash in the result file and the lock record; the result file's SHA-256 matches the run manifest. All three figures were drawn by a script that reads only the result file.
Not checked. The study was not re-run for this paper. The literature was found by five searches run on 9 November 2026 and read at the level of abstracts, publisher pages and search summaries; the full texts of the cited papers were not read.
Terms on this page
Each term is defined where it is first used on this page. Each name below opens its entry in the findings glossary, which lists every page that uses it.
- proper scoring rule decision theory and forecast verification first use
- Brier score forecast verification, from weather forecasting first use
- selective prediction machine learning first use
- risk-coverage curve machine learning, selective prediction first use
- extremising forecast aggregation first use
- preregistration research method (metascience) first use
- planted check research method; called a positive control in experimental science first use
- verdict research method (our usage) first use
- control statistics and experimental design first use
- CC0 1.0 copyright and data licensing first use
- prediction market economics and forecasting first use
- SHA-256 cryptography first use
- voided question the Good Judgment Project tournament first use
- superteam the Good Judgment Project design first use
- skip our usage first use
- relative Brier score forecast verification, our usage first use
- forecaster-year our usage first use
- stratum survey statistics first use
- Spearman correlation (rho) rank statistics first use
- 95% interval statistics first use
- bootstrap statistics first use
- log-odds statistics first use
- held-out gain machine learning first use
- out-of-fold prediction machine learning, cross-validation first use
- area under the risk-coverage curve machine learning, selective prediction first use
- p value (from draws) statistics first use
- null distribution statistics first use
- positive control experimental design first use
- test-retest correlation psychometrics first use
- expected calibration error forecast verification and machine learning first use
- findings ledger our records first use
To report an error, name the finding, the claim number and the source on the Work page, which gives the address. Accepted corrections join the Trail with their date.