
Findings F28 Method and statistics, Psychology and perception found 2026-10-29
Forecasts people rate low are worse and more hedged, and people who skip more score better
In 1,064,355 Good Judgment Project forecasts, a forecast its author rated low was a little worse and already nearer 50 percent, and people who skipped more questions scored better on the ones they answered. Both are associations, and the follow-up study F32 narrowed both: the stated probability already carries what the self-rating knows, and no within-person benefit of skipping was shown.
- Tier
- B, signal
- Outcome
- mixed
- Rung
- hypothesis
- Corrections
- 2, latest 2026-11-14
- Version
- v2, 2026-11-14
- Redo it
- Reproduce
Download PDF 501 KB BuildTeX source F28.bld
What this means for a reader
When people in a large forecasting tournament said they knew little about a question, their forecast was a little worse, and they had already moved it toward 50 percent. People who answered fewer of the questions open to them scored better on the ones they did answer. Both patterns are associations in people who chose their own ratings and questions. The follow-up study found that the stated probability already carries what the self-rating knows, and that a person who skips more in one year than the last does not clearly score better, so a habit of skipping marks a careful forecaster and is not shown to improve an answer.
Objection
Nothing here is causal. People chose their ratings, their questions and when to forecast.
What would change the call. Read together with F32, and repeat on data that records when a forecaster declined a question.
From the paper's first stated limitation; our register records no separate objection.
Abstract
A source that can say "I am not sure" or decline to answer is only useful if those signals mean something. We tested both on the public survey forecasts of the Good Judgment Project, where volunteers rated their own expertise from 1 to 5 on each forecast and chose which questions to answer. Within a forecaster-year, one point of self-rated expertise went with a relative Brier score better by 0.0226 (95 percent interval 0.0185 to 0.0270) across 3,780 forecaster-years. Forecasts rated expertise 1 scored 0.0218 worse (0.0155 to 0.0285) than the same person's forecasts rated 2 to 5 and sat 0.055 nearer to 50 percent (0.051 to 0.058), across 1,826 forecaster-years. The preregistered prediction was that low-rated forecasts would be worse and no less hedged, and it failed on the hedging rule. With question-by-time medians the gap fell to 0.0156 (0.0094 to 0.0219), under the preregistered bar of 0.02. At matched forecast count, skip rate correlated with better relative Brier score at rho +0.351 (+0.331 to +0.368) across 9,204 forecaster-years. Inside the same strata skip rate correlated +0.452 with updates per answered question, so this round does not separate skipping from updating. A second round, published as F32, removed the updates and narrowed two of these readings; this paper states what it changed.
c1 observed, evidence for claim 1
- The numbers in claim 1
- 0.0226; 95; 0.0185; 0.0270; 3,780 matches the result file, 2026-11-14
- Basis
- observed: measured in this study, with a result file
c2 observed, evidence for claim 2
- The numbers in claim 2
- 1; 0.0218; 0.0155; 0.0285; 2; 5; 0.055; 50; 0.051; 0.058; 1,826 matches the result file, 2026-11-14
- Chart 1
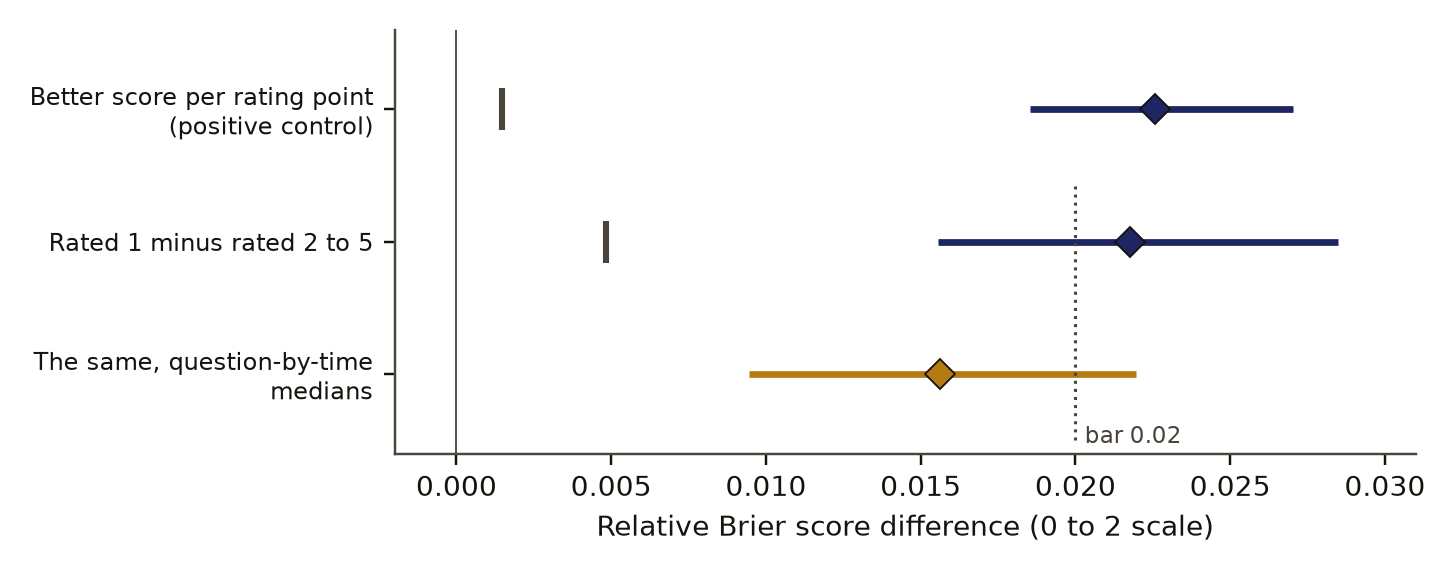
- How the low-rating prediction was tested, and why it failed.
- Basis
- observed: measured in this study, with a result file
c3 observed, evidence for claim 3
- The numbers in claim 3
- 0.0156; 0.0094; 0.0219; 0.02 matches the result file, 2026-11-14
- Chart 1
- How the low-rating prediction was tested, and why it failed.
- Basis
- observed: measured in this study, with a result file
c4 observed, evidence for claim 4
- The numbers in claim 4
- +0.351; +0.331; +0.368; 9,204 matches the result file, 2026-11-14
- Chart 2
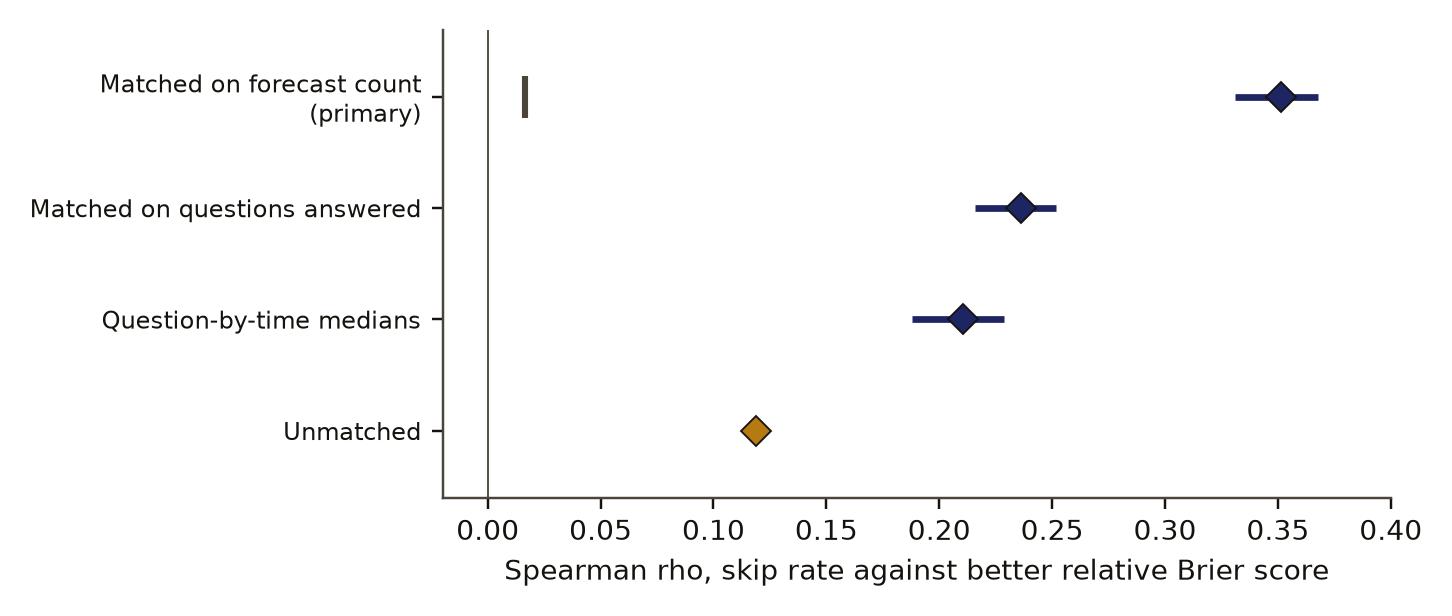
- Skip rate and accuracy across forecaster-years, four ways of matching.
- Basis
- observed: measured in this study, with a result file
c5 observed, evidence for claim 5
- The numbers in claim 5
- +0.452 matches the result file, 2026-11-14
- Basis
- observed: measured in this study, with a result file
Introduction
The Good Judgment Project ran from 2011 to 2015 inside a geopolitical forecasting tournament. Thousands of volunteers gave probabilities for world events, and the project tested training, teaming and tracking as ways to raise accuracy [2]. Its survey forecasts are public, and for the first three years each forecast carries the forecaster's own 1 to 5 rating of their expertise on that question.
Two things in those files bear on a practical design question: how software that collects answers from many sources should treat a source's stated confidence, and whether it should let a source decline. The first is the self-rating. A review of ways to identify skilled forecasters lists the same 1 to 5 item among expertise-based predictors and attributes it to the project's own papers [5]. The second is the choice of questions. Merkle, Steyvers, Mellers and Tetlock [3] pointed out that a Brier scoreDefinition: Brier score forecast verification, from weather forecasting The squared difference between the stated probabilities and the outcomes, here summed over the answer options in the Good Judgment Project form so it runs from 0 to 2. Lower is better. Excludes questions left unanswered, which it does not score. full definition, the squared difference between stated probabilities and outcomes, looks only at the forecasts a person submitted, and asked whether the questions a person selects add information about their ability. A Brier score is lower when better, and it gives no score to a question left unanswered.
We asked two questions of the data. Within one person, does a low self-rating mark a worse forecast, and is that forecast already hedged? Across people, do those who skip more score better on what they answer? The decision the study informed was whether an abstain filter in Flywheel, our accountability software, can use a source's own confidence report or needs an outside measure. Our searches for this paper returned the two works above and the project's own account of its best forecasters [4]; none of the search results gave an effect size for the self-rating inside one person, which is what a search returned and no proof that none is published.
Preregistration and design
The preregistrationDefinition: preregistration research method (metascience) A dated written plan for a study, fixed and hash-locked before any result is seen: the question, the data, the statistic, the controls, the forecasts and the kill conditions. Excludes a plan revised after looking at the outcome, and a protocol written only for the record after the run. full definition, a dated plan fixed and hash-locked before any result is seen, was written on 29 October 2026 and locked at 14:29:13 UTC that day. Before writing it we had seen file lists, column headers, and counts of questions, forecasts and rating levels with no outcome joined to any forecast. No Brier score had been computed on the real data. The code had been run on synthetic files shaped like the real ones, with effects built in that it recovered, which is a planted checkDefinition: planted check research method; called a positive control in experimental science Data built so that the right answer is known, run through the same analysis before the real data, to show that the analysis can see the effect when it is there. Excludes any check made on the real data, which cannot show what the analysis misses. full definition: data with a known answer run through the same analysis first, to show the analysis can see an effect when one is there.
The plan names seven verdictsDefinition: verdict research method (our usage) The pass or fail of one preregistered rule set against the run's numbers, read off by code. Excludes an interpretation written after reading the numbers. full definition, each a set of rules that must all hold, read off by code. A verdict in our usage is that pass or fail and never a reading written after the numbers were seen. It also states a prior probability for each main verdict (0.8, 0.25 and 0.35 for the positive control, the low-rating prediction and the skipping prediction) and a mapping from outcomes to the filter design. Appendix A gives every rule.
Data and provenance
The data are the Good Judgment Project survey forecasts for years 1 to 4 and the question file, published on the Harvard Dataverse under CC0 1.0Definition: CC0 1.0 copyright and data licensing The Creative Commons public domain dedication, under which anyone may reuse the work for any purpose without permission. Excludes a licence condition requiring citation, which stays a scholarly courtesy. full definition, the Creative Commons public domain dedication, which allows any reuse and leaves citation as a courtesy [1]. The SHA-256 of each of the five input files was recorded in the run's result file.
The survey files hold 3,143,460 rows, one per answer option. Dropping 43,944 withdrawal rows left 1,234,940 forecasts. We dropped 157,189 forecasts on questions that were voided or had no recorded outcome, 13,381 dated after the question closed and 15 whose probabilities could not be repaired. That leaves 1,064,355 scored forecasts. Self-rated expertise exists in years 1 to 3 only, on 410,451 scored binary forecasts. Only aggregates and distributions were stored; no value for any single forecaster was written to any output.
The files hold no record of a declined question. A skipDefinition: skip our usage A closed question that was open during a forecaster's active window in a year and that they never answered, inferred from the data. Excludes questions outside the active window, and any recorded decision to decline, which the data do not hold. full definition is inferred: a closed question that was open during a forecaster's active window in a year and that they never answered. The word excludes any recorded decision to decline, which the data do not have, so a skipped question may have been unseen.
Methods
Scores
Each forecast is scored with the Brier score in the project's form, summed over the answer options, so it runs from 0 to 2:
where is the stated probability of option and is 1 if that option occurred and 0 otherwise. The relative Brier scoreDefinition: relative Brier score forecast verification, our usage A forecast's Brier score minus the median Brier score of all scored survey forecasts on the same question. Lower is better. Excludes the difficulty of the question, which subtracting the median removes. full definition of a forecast is minus the median of all scored survey forecasts on the same question, so it measures skill against the crowd and leaves out how hard the question was. The secondary form takes the median inside the question and the fifth of its open period in which the forecast was made. ExtremityDefinition: extremity judgment and forecasting research The distance of a binary forecast from 50 percent, from 0 for a coin-flip forecast to 0.5 for a certain one. Excludes whether the forecast was right, and how well calibrated the forecaster is. full definition is the distance of a binary forecast from 50 percent, , from 0 to 0.5; it measures how hedged a forecast is and says nothing about whether it was right. The unit is the forecaster-yearDefinition: forecaster-year our usage One person's forecasts within one tournament year, the unit for every statistic here. Excludes pooling of different people, and pooling one person's years. full definition, one person's forecasts within one tournament year, so a person active in three years counts three times.
The within-person tests
The positive controlDefinition: positive control experimental design A test of an effect expected to be present, which the instrument must detect for its other readings to be trusted. Excludes a shuffle control, which removes an effect instead. full definition tests an effect that should be there for the other readings to be trusted: that self-rated expertise goes with accuracy at all. For forecaster-years with at least 10 scored binary forecasts using two or more rating levels, relative Brier score and rating were both centred within the forecaster-year, and one slope was fitted to the pooled data. The reported quantity is , so a positive value means a higher rating goes with a better score.
The low-rating test uses forecaster-years with at least 5 forecasts rated 1 and 5 rated 2 to 5. For each it takes
where is the mean relative Brier score of the forecasts rated 1 and that of the forecasts rated 2 to 5, and the matching difference in extremity, . The statistic is the mean over forecaster-years. The preregistered bar for was 0.02 on the 0 to 2 scale.
Skip rate and the matched correlation
A forecaster-year is eligible with at least 10 available questions and 5 answered. Its skip rate is
with the available questions answered and the number available. Busy forecasters answer more, so the correlation is taken inside each stratumDefinition: stratum survey statistics A group of units alike on the matched variables, here year and twentieth of forecast count, inside which a statistic is computed before averaging. Excludes control for variables that were not matched. full definition of year and twentieth of forecast count, a group alike on the matched variables, and averaged with weights equal to stratum size:
where is the Spearman rhoDefinition: Spearman rho statistics The correlation between the ranks of two quantities, from -1 to 1, which counts any steadily rising or falling relation and is not pulled by single extreme values. Excludes the slope of a relation, and evidence of cause. full definition, the correlation of ranks, between skip rate and the negative of the forecaster-year's mean relative score. Strata with fewer than 10 forecaster-years were dropped. Matching controls only the matched variables.
Intervals
Every 95 percent intervalDefinition: 95% interval statistics The range that holds the middle 95 percent of the bootstrap or control draws for a number. We report it beside the number. Excludes a statement that the true value lies inside with 95 percent probability. full definition is the middle 95 percent of bootstrapDefinition: bootstrap statistics Recomputing a statistic many times on forecaster-years resampled with replacement to read how much the estimate varies. Excludes an interval from a textbook formula that assumes a distribution. full definition draws, a resampling of forecaster-years with replacement that assumes no textbook distribution: 2,000 draws for the low-rating test and 1,000 for the others, the skip test resampling inside strata.
Controls and planted checks
Each controlDefinition: control statistics and experimental design A version of the data with the structure under test removed (for example shuffled or pooled), scored the same way as the real data, so the real score has something to beat. Excludes a comparison with a different dataset or with a published number. full definition is a copy of the data with one link broken by shuffling and scored with the same code; a comparison with another dataset is not a control. Three were fixed in advance, with 1,000 draws each, and the 95th percentile of each one's null distributionDefinition: null distribution statistics The spread of scores a control gives over many random draws. Its 95th percentile is the bar a real score must clear. Excludes a theoretical distribution assumed rather than drawn from the data. full definition is the bar the real value must clear.
- data1,064,355 scored forecastsGood Judgment Project survey forecasts, years 1 to 4. Self-rated expertise, 1 to 5, exists in years 1 to 3.
- measurementRelative Brier scoreEach forecast's squared error minus the median for its question, on a 0 to 2 scale. The gap is rated 1 minus rated 2 to 5, inside one forecaster-year.
- controlControl: ratings shuffledRatings shuffled within each forecaster-year, 1,000 times. The 95th percentile of the shuffled gap is 0.0048.
- rule set in advanceRule: worse and no less hedgedThe gap had to reach 0.02 with its interval above 0 and above the shuffle, and the low-rated forecasts could be at most 0.02 nearer 50 percent.
- failed on hedgingWorse by 0.0218, and 0.055 more hedgedThe extremity difference was -0.0548 (-0.0584 to -0.0514), past the limit of -0.02. With question-by-time medians the gap was 0.0156, under the bar.
Read from result.json, run 20261029T142954Z. SHA-256 of the run's file bd52e655dd11e74f24bd5eb51b100db1353c8cefaa39818c26c0b7e23b701f50 and of the published copy 161f2519a06eac16a83e24eca491b91a521e426980f48cf85e77d395df1ffa6d. In the copy, file paths are cut to the file name and the layout (indentation, line endings) may differ; every value is the same.
- Ratings shuffled within forecaster-year, the null for the mean of .
- Ratings shuffled within forecaster-year, the null for the positive-control slope.
- Skip rate shuffled within year and forecast-count strata, the null for .
The activity check asks whether matching did its job: the mean correlation of skip rate with forecast count inside strata must be under 0.2 in size. A p value from drawsDefinition: p value (from draws) statistics The share of control draws scoring at or above the real score, with one added to the count and to the number of draws, so it is never zero. Excludes a p value from a textbook formula that assumes a distribution. full definition is the share of control draws at or above the real value, with one added to the count and to the number of draws, so 1,000 draws cannot give less than 0.001.
Results
Self-rating inside one person
The positive control passed. Within a forecaster-year, one point of self-rated expertise went with a relative Brier score better by 0.0226 (95 percent interval 0.0185 to 0.0270) across 3,780 forecaster-years. The shuffle's 95th percentile was 0.0015 (p 0.001), and the test covered 398,463 forecasts. Each point of rating also went with a forecast 0.037 further from 50 percent (0.034 to 0.040).
Forecasts rated expertise 1 scored 0.0218 worse (0.0155 to 0.0285) than the same person's forecasts rated 2 to 5 and sat 0.055 nearer to 50 percent (0.051 to 0.058), across 1,826 forecaster-years. The sample held 243,486 forecasts, 77,572 of them rated 1. The score gap cleared the shuffle's 95th percentile of 0.0048 (p 0.001) and cleared the 0.02 bar by 0.0018. The verdict still failed, because the prediction was "worse and no less hedged" and the extremity rule required the lower bound of to be above -0.02; it was -0.058. The effect is small beside the spread between people: the low-rated forecasts were the worse ones in 55 percent of forecaster-years, and the median gap was 0.018.
With question-by-time medians the gap fell to 0.0156 (0.0094 to 0.0219), under the preregistered bar of 0.02. Figure 1 and Table 1 give the three within-person effects.
Skipping
Across the 9,204 eligible forecaster-years (1,781; 1,114; 1,360 and 4,949 in years 1 to 4) the median skip rate was 0.59. At matched forecast count, skip rate correlated with better relative Brier score at rho +0.351 (+0.331 to +0.368) across 9,204 forecaster-years. The shuffle's 95th percentile was +0.017 (p 0.001). The activity check passed: skip rate correlated -0.613 with forecast count overall and -0.078 inside strata. Matching matters to the size of the number. Unmatched, the correlation was +0.119. Matched on questions answered in place of forecasts it was +0.236 (+0.216 to +0.252), and with question-by-time medians +0.211 (+0.188 to +0.229). Figure 2 draws the four.
rank correlation, rho (above 0: more skipping goes with better accuracy)
- Correlation between skipping and accuracy
- 95% bootstrap interval, resampling forecaster-years inside strata; the unmatched value has none in the result file
- shuffle 95th percentile, 0.017
Data behind chart 2 4 rows
| Matching | rho | Low | High |
|---|---|---|---|
| Matched on forecast count (primary) | +0.351 | +0.331 | +0.368 |
| Matched on questions answered | +0.236 | +0.216 | +0.252 |
| Matched, question-by-time medians | +0.211 | +0.188 | +0.229 |
| Unmatched | +0.119 | none | none |
Read from result.json, run 20261029T142954Z. SHA-256 of the run's file bd52e655dd11e74f24bd5eb51b100db1353c8cefaa39818c26c0b7e23b701f50 and of the published copy 161f2519a06eac16a83e24eca491b91a521e426980f48cf85e77d395df1ffa6d. In the copy, file paths are cut to the file name and the layout (indentation, line endings) may differ; every value is the same.
Inside the same strata skip rate correlated +0.452 with updates per answered question, so this round does not separate skipping from updating. The preregistration named this before the run: at a fixed forecast count, a person who answers fewer questions must update each one more, and updating goes with accuracy in this tournament.
Table 2 sets the priors against the outcomes.
Discussion
The self-rating means something inside one person: a forecast rated low is a worse forecast. People had also acted on that knowledge already, since the low-rated forecasts sit nearer 50 percent. The decision mapping written before the run read this outcome as "self-report modulates the stated probability and is usable as one input" to a filter. The first-round write-up went one step further and read "worse and hedged" as the rating carrying information past the stated probability.
The second round, F32, tested that step and took it back. It found that forecasts rated 1 are pulled toward 50 percent by about the right amount, with a best rescaling factor of 0.92 (0.79 to 1.06) where 1 means right-sized, and that adding the self-rating to a filter on the stated probability gained 0.0026 in area under the risk-coverage curve against a bar of 0.005, while a rating shuffled within each forecaster-year gained 0.0024. A calibrated forecast from a less informed person scores worse, and its stated probability already says by how much.
F32 also removed the confound on skipping. Counting each person's first forecast on a question only, the matched correlation was +0.286 (+0.264 to +0.303), and +0.195 with timing matched as well, so most of the +0.351 reported here survives the removal of every update. Within the same person across consecutive years it was +0.041 (-0.007 to +0.095) over 1,578 pairs, which shows no benefit to a person from skipping more. The supported reading is a trait: people who answer selectively tend to be better forecasters.
Merkle and colleagues [3] studied question selection in the same tournament. We read their abstract only, in a search snippet that was cut short, so we do not compare signs or sizes with their result.
Limitations
- Nothing here is causal. People chose their ratings, their questions and when to forecast.
- Skips are inferred. A question counted as skipped may have been unseen, and "available" means any closed question open during the forecaster's active window.
- The skip correlation in this round includes updates. F32 puts the first-forecast value at +0.286 and found no within-person effect.
- The low-rating gap clears its 0.02 bar by 0.0018, with an interval from 0.0155 to 0.0285, and falls under the bar with question-by-time medians. The 0.02 bar was a choice.
- The reading that the self-rating adds information past the stated probability did not survive F32.
- Year 4 has no self-ratings, prediction-market trades were not used, and nothing here speaks for language models or for any named person.
- Scoring was done by our own code and was not blind.
Evidence
Mixed. The prediction that low-rated forecasts are worse and no less hedged failed: they sat 0.055 nearer 50 percent (interval 0.051 to 0.058) against a limit of 0.02. With question-by-time medians the score gap was 0.0156, under the 0.02 bar. The skip correlation of +0.351 includes updates; F32 puts it at +0.286 on first forecasts and found no within-person effect (+0.041, interval -0.007 to +0.095).
Figures
These are the paper's own figures, numbered as in the PDF, and each "Figure" reference in the text points here. The charts on this page redraw the same results from the result files and carry their own numbers.
Tables
| Effect | Value | 95 percent interval | Shuffle | p |
|---|---|---|---|---|
| Better score per rating point, 3,780 forecaster-years | 0.0226 | 0.0185 to 0.0270 | 0.0015 | 0.001 |
| Rated 1 minus rated 2 to 5, score, 1,826 | +0.0218 | +0.0155 to +0.0285 | 0.0048 | 0.001 |
| The same with question-by-time medians | +0.0156 | +0.0094 to +0.0219 | none | none |
| Rated 1 minus rated 2 to 5, extremity | -0.0548 | -0.0584 to -0.0514 | none | none |
| Verdict | Prior of a pass | Outcome |
|---|---|---|
| Positive control | 0.8 | pass |
| Low-rated forecasts worse and no less hedged | 0.25 | fail: worse by 0.0218, and 0.055 more hedged |
| Skippers score better at matched activity | 0.35 | pass, with the updating confound the plan warned of |
Appendix A. The preregistered verdicts
Each verdict is a set of rules written before the run. A verdict passes only when every rule holds. Values are read from the run's result file.
| Verdict | Deciding rules | Value | Holds |
|---|---|---|---|
| Positive control | slope above 0; lower bound above 0; above shuffle 95th percentile (0.0015) | 0.0226; 0.0185 | pass |
| Low rating: worse, no less hedged | gap at least 0.02; lower bound above 0; above shuffle 95th percentile (0.0048); extremity lower bound above -0.02 | 0.0218; 0.0155; -0.058 | fail |
| The same, question-by-time | gap at least 0.02; lower bound above 0; extremity lower bound above -0.02 | 0.0156; 0.0094; -0.058 | fail |
| Skippers score better | rho at least 0.05; lower bound above 0; above shuffle 95th percentile (0.017) | +0.351; +0.331 | pass |
| Activity check | skip against forecast count inside strata under 0.2 in size | 0.078 | pass |
| Matched on questions answered | rho above 0; lower bound above 0 | +0.236; +0.216 | pass |
| Question-by-time | rho above 0; lower bound above 0 | +0.211; +0.188 | pass |
Numbers recorded in our publication register
| What | Value |
|---|---|
| Sample | 1,064,355 scored forecasts; 3,780 and 9,204 forecaster-years |
| Main estimate and interval | better score per rating point 0.0226 (0.0185 to 0.0270); skip correlation +0.351 (+0.331 to +0.368) |
| Forecast against outcome | Did not hold: low-rated forecasts worse and no less hedged (prior 0.25). Passed: skippers score better at matched activity (prior 0.35) |
| Known-answer check | the positive control passed: self-rating goes with accuracy within a person |
As recorded in the publication register, the summary row each finding gets; the paper's own numbers above were re-read from the result files.
What lowers it
- blinding Not blind: the analyst saw the data's shape before the lock. from our publication register, on blinding
- novelty Nearby work exists; novelty is not shown. from our publication register, on the literature
- depth of reading The cited literature was read at the level of search snippets; full texts were not read. from the Verified section
What holds it up
- scoring Scored by code against rules fixed in advance. from our publication register, on who scored it
- preregistration Preregistered and hash-locked before the run (sha256 723e0f54). from the Reproduce section
- control Controls: the shuffles worked and the activity check passed; the plan named updating as a confound before the run. from our publication register, on controls
- open data Public data. from our publication register, on the data licence
Where the claim stands
- lead
- hypothesis
- thesis
- conjecture
- theorem
- law candidate
- killed
A preregistration with pass-or-fail rules is on file, which this rung needs. The next rung needs a named rival reading beaten by a decisive observation, and none is on file. Tier B: Large public data with working shuffle controls and a preregistration. The follow-up finding F32 shows the skip correlation is partly updating and timing, and the score gap for low-rated forecasts clears its bar by only 0.0018.
Trail
Versions
- v2 2026-11-14, paper version 1.0, first published PDF sha256 2d2d017b04bee135
- v1 2026-10-29, entered in the findings ledger
Corrections
2026-11-14 scope found by the publication pass
Narrowed the published claim to an association across and within people because the ledger's first reading, that self-report is usable as an input with signal past the stated probability, did not survive F32.
2026-10-29 scope found by the study itself, before publication
The second round (F32) narrowed two readings of this round. now The skip correlation of +0.351 includes updates; on first forecasts it is +0.286, and no within-person benefit of skipping was shown. The self-rating was read here as carrying information past the stated probability; F32 found the probability already carries it.
Standing, and the ledger entries it rests on
2026-10-29 narrowed in part F32
Set by hand from findings ledger entry F32, dated 2026-10-29: the skip correlation and the reading of the self-rating. Rests on findings ledger, F32.
Each correction is a dated note; the findings ledger is never rewritten, and a note governs where it differs.
Ledger and version dates up to publication are local dates in US Pacific time. Clock times in the text are UTC, seven or eight hours ahead, so a lock or a run stamped just after midnight UTC belongs to the previous local day. Corrections from 14 November 2026 on are dated in UTC.
References
- Mellers, B. and others. Good Judgment Project data: survey forecasts, years 1 to 4, and question file. Harvard Dataverse, CC0 1.0. doi:10.7910/DVN/BPCDH5 run here Licence: CC0, Harvard Dataverse doi:10.7910/DVN/BPCDH5 used in Data and provenance
- Mellers, B., Ungar, L., Baron, J., Ramos, J., Gurcay, B., Fincher, K., Scott, S. E., Moore, D., Atanasov, P., Swift, S. A., Murray, T., Stone, E. and Tetlock, P. E. (2014). Psychological strategies for winning a geopolitical forecasting tournament. Psychological Science 25(5), 1106-1115. doi:10.1177/0956797614524255 abstract or summary, 2026-11-14: search snippets; full text not read used in Introduction
- Merkle, E. C., Steyvers, M., Mellers, B. and Tetlock, P. E. (2017). A neglected dimension of good forecasting judgment: the questions we choose also matter. International Journal of Forecasting 33(4), 817-832. doi:10.1016/j.ijforecast.2017.04.002 abstract or summary, 2026-11-14: search snippets; full text not read used in Introduction, Discussion
- Mellers, B. and others (2015). Identifying and cultivating superforecasters as a method of improving probabilistic predictions. Perspectives on Psychological Science 10(3), 267-281. abstract or summary, 2026-11-14: search snippets; full text not read used in Introduction
- Atanasov, P. and others (2023). Talent spotting in crowd prediction. Cited from a search result; the venue was not confirmed. abstract or summary, 2026-11-14: search snippets; full text not read used in Introduction
- F32 Forecasters who skip questions score better, and the best filter reads the probability run here listed, not cited in the text
Cited by later findings
- F32 narrowed in part, the skip correlation and the reading of the self-rating, 2026-10-29 (record findings ledger, F32). On first forecasts only the matched skip correlation is +0.286 against +0.351 here, the within-person value is +0.041 (-0.007 to +0.095), and adding the self-rating to a probability filter gained 0.0026 against a 0.005 bar.
Reproduce
Data
- Mellers, B. Licence: CC0, Harvard Dataverse doi:10.7910/DVN/BPCDH5. https://doi.org/10.7910/DVN/BPCDH5
Preregistration
sha256 723e0f541d7fe7ade90a45e04e6c3c15e853955f1a903c8ff5f75f2f952d12cb
plan 71bedc68ab6171ff3526e5d0eaa0502204ee4891e1a58103345152786b7bb720
Steps
- Data: Good Judgment Project survey forecasts, years 1 to 4, and the question file, Harvard Dataverse, CC0 1.0, doi:10.7910/DVN/BPCDH5.
- Drop withdrawals, forecasts on voided or unresolved questions, forecasts dated after close and unrepairable probabilities. Score each forecast with eq. 1 and subtract the question's median score.
- Fit the pooled within-forecaster-year slope of relative score on rating. Compute eq. 2 and the extremity difference for forecaster-years with 5 or more forecasts in each arm.
- For each forecaster-year with at least 10 available and 5 answered questions, compute eq. 3 and take eq. 4 inside year and forecast-count strata.
- Shuffle ratings within forecaster-year and skip rates within strata, 1,000 times each, and rescore.
- Seed 20261029 (numpy generator, consumed in the preregistered order).
- Preregistration SHA-256: 723e0f541d7fe7ade90a45e04e6c3c15e853955f1a903c8ff5f75f2f952d12cb. Plan SHA-256: 71bedc68ab6171ff3526e5d0eaa0502204ee4891e1a58103345152786b7bb720. Run 20261029T142954Z.
Cost. About 154 seconds for the analysis and 107 seconds for the controls on one desktop computer. The study was not re-run for this paper.
Downloads
- Whitepaper, PDF F28.pdf, 501 KB
- BuildTeX source F28.bld, 32 KB
- Build receipt F28.buildtex.json, 1 KB
- BuildLang doc module doc.bld, 5 KB, imported by the source
The PDF is typeset by BuildTeX from F28.bld, which is written from the same source as this page. The receipt records the source's SHA-256 and the PDF's (2d2d017b04be), so anyone can rebuild it and compare. The copy here has its hidden author field blanked, as the site does for every file it publishes; blank the same field in a rebuild before comparing. The name stays on the first page.
Verified
Verified on 2026-11-14. On 14 November 2026 every count, slope, gap, correlation, interval, shuffle percentile, p value and verdict rule in this paper was re-read from the run's result file. They match the findings ledgerDefinition: findings ledger our records The append-only, dated list of every result we have recorded, numbered F1, F2 and on. Corrections are added as new dated lines and old entries are never rewritten. Excludes a curated list of successes. full definition, our append-only dated list of recorded results. The preregistration's SHA-256 was recomputed from the locked file and matches the hash in the result file and the lock record. The priors were read from the preregistration. The F32 numbers quoted in the discussion were re-read from the published F32 paper. Both figures were drawn by a script that reads only the result file. The literature was found by two searches run on 14 November 2026 and read at the level of search snippets; no abstract or full text was opened.
Not checked. The study was not re-run for this paper.
Terms on this page
Each term is defined where it is first used on this page. Each name below opens its entry in the findings glossary, which lists every page that uses it.
- Brier score forecast verification, from weather forecasting first use
- preregistration research method (metascience) first use
- planted check research method; called a positive control in experimental science first use
- verdict research method (our usage) first use
- CC0 1.0 copyright and data licensing first use
- skip our usage first use
- relative Brier score forecast verification, our usage first use
- extremity judgment and forecasting research first use
- forecaster-year our usage first use
- positive control experimental design first use
- stratum survey statistics first use
- Spearman rho statistics first use
- 95% interval statistics first use
- bootstrap statistics first use
- control statistics and experimental design first use
- null distribution statistics first use
- p value (from draws) statistics first use
- findings ledger our records first use
To report an error, name the finding, the claim number and the source on the Work page, which gives the address. Accepted corrections join the Trail with their date.