
Findings F81 Biology and medicine, Optics, colour and imaging, Plants, trees and earth found 2026-10-29
Among colours people cannot tell apart, modelled bees and blue tits split flowers from backgrounds more often
On 728 measured natural surfaces, modelled bees and blue tits separate flower-against-background pairs that look identical to people more often than background-against-background pairs. No animal was tested; the observers are models. The direction held on a second surface set and under a second noise model; the size of the effect did not travel.
- Tier
- B, signal
- Outcome
- held
- Rung
- hypothesis
- Verdicts
- 24 passed, 9 failed
- Corrections
- 2, latest 2026-11-14
- Version
- v4, 2026-11-14
- Redo it
- Reproduce
Download PDF 594 KB BuildTeX source F81.bld
What this means for a reader
A meadow that looks plain to us is full of colour differences we cannot see. In this collection of surfaces, those hidden differences cluster between flowers and what surrounds them, which fits the old idea that flower colours are tuned to the animals that visit them. The ultraviolet channel is textbook, and earlier work used this same data to study flower signals. What this paper adds is a direct count of the differences a person misses, with a control for chance and a check of how far the count can be trusted. The direction can be trusted on two sets of surfaces; the exact size cannot.
Objection
The instrument check failed twice, with Weber noise and with photon noise, so the model is too fine for at least the bee. Only the direction of the ratio is claimed.
What would change the call. Pass the instrument check with noise values sourced for each species, then match backgrounds to each flower's own site and test behaviour.
From the paper's first stated limitation; our register records no separate objection.
Abstract
Two surfaces can look the same colour to a person and differ sharply to a bee, which sees ultraviolet. We asked where such hidden differences fall among 728 measured Australian surfaces: 221 flower petals and 507 rocks, bark and leaves. Each observer was modelled with the receptor-noise-limited model and published receptor curves. Among pairs a modelled human cannot separate, modelled bees and blue tits separate flower-background pairs more often than background-background pairs, and the separation ratio exceeded its label-shuffle 95th percentile in every condition tested: two noise models on the first set, and two on a second set of Californian flowers against North American soil and leaf litter. The size of the ratio did not travel: for the bee it was 2.04 with Weber noise and 1.67 with photon noise added on the first set, and 45.6 on the second set, where the backgrounds are brown and alike. A preregistered instrument check failed under both noise models: the model resolves finer wavelength steps than bees show in behaviour, so only the direction of the effect is claimed.
c1 observed, evidence for claim 1
- The numbers in claim 1
- 95 matches the result file, 2026-11-09
- Chart 1
- How the separation ratio was measured and checked.
- Chart 2
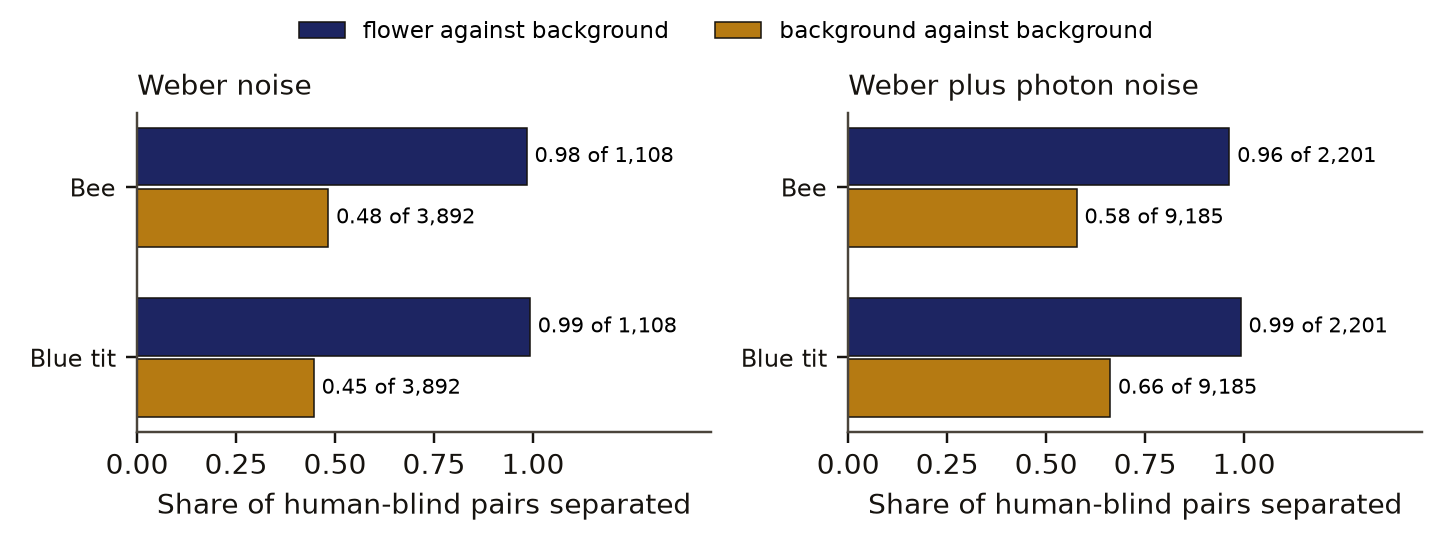
- Share of human-blind pairs that the bee and the blue tit separate.
- Chart 3
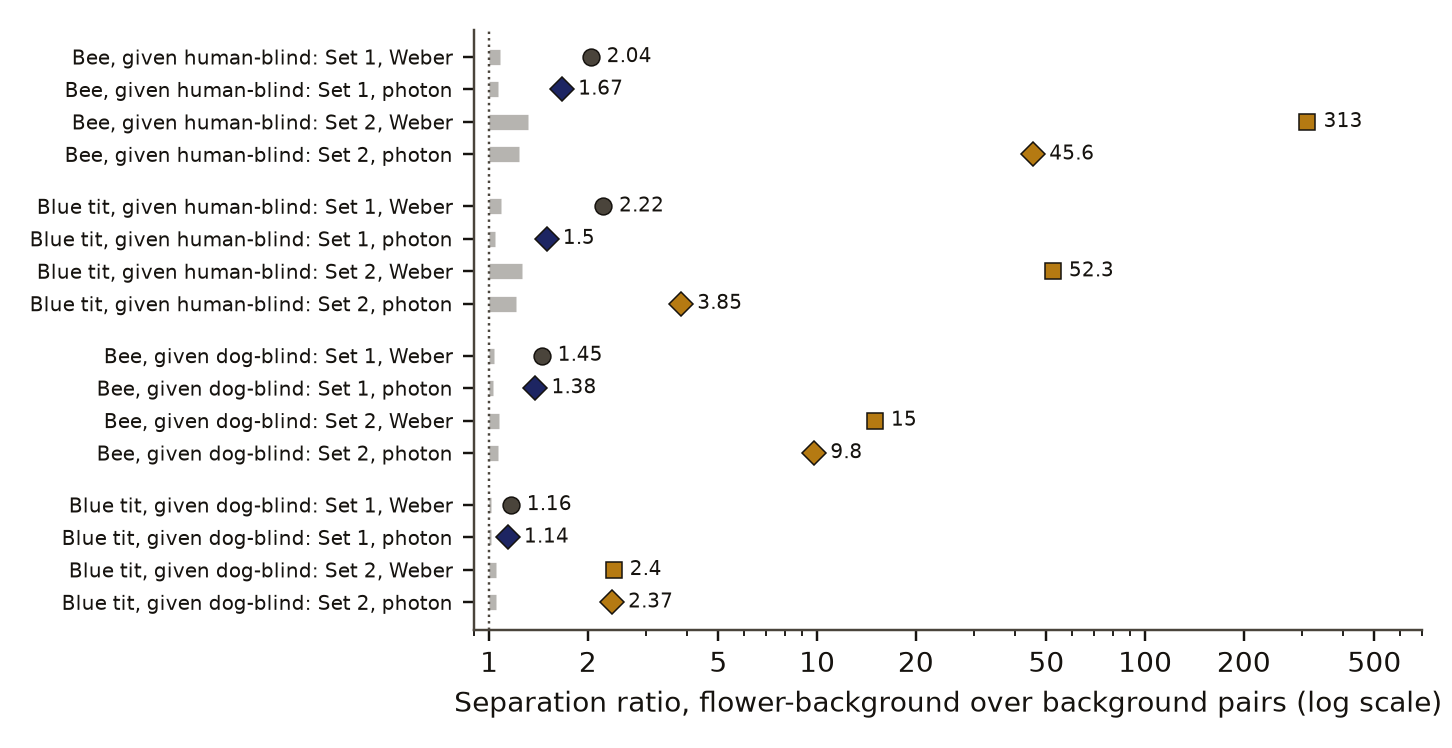
- Separation ratios against their label-shuffle ranges, on a log scale.
- Basis
- observed: measured in this study, with a result file
c2 observed, evidence for claim 2
- The numbers in claim 2
- 2.04; 1.67; 45.6 matches the result file, 2026-11-09
- Chart 3
- Separation ratios against their label-shuffle ranges, on a log scale.
- Basis
- observed: measured in this study, with a result file
c3 observed, evidence for claim 3
- Chart 1
- How the separation ratio was measured and checked.
- Chart 4
- The instrument check: the model's finest wavelength step against the range seen in behaviour.
- Basis
- observed: measured in this study, with a result file
- Numbers
- None in the sentence; it reads the numbers stated beside it.
Introduction
Each animal's colour vision rests on a few receptor classesDefinition: receptor class vision science One kind of light-sensitive cell in the eye, defined by the wavelengths it responds to. Humans have three cone classes, bees three including one for ultraviolet, blue tits four. Excludes the rods used in dim light, and the nerve cells that compare receptor signals. full definition. People have three cone classes, the honeybee three with one in the ultraviolet, and the blue tit four with one in the ultraviolet. Two surfaces can give the same signals in a person's cones and different signals in a bee's, so the bee tells apart what the person cannot.
The standard way to compute such differences is the receptor-noise-limited modelDefinition: receptor-noise-limited model visual ecology The model of Vorobyev and Osorio in which two colours can be told apart when the difference in log receptor signals is large compared with the noise in each receptor class. Brightness differences are left out. Excludes models of colour appearance, and any effect of pattern, motion or learning. full definition of Vorobyev and Osorio [1]. It treats colour as coded by comparisons between receptor classes and sets the threshold by the noise in each class. A distance of one just-noticeable difference (JND)Definition: just-noticeable difference (JND) psychophysics The unit of colour distance in the receptor-noise-limited model. A distance of 1 is treated as the threshold, so pairs at or below 1 count as indistinguishable for that observer. Excludes a measured threshold for a real animal on a real task. full definition is the threshold. The model was built to predict colour thresholds for animals whose eyes have been measured but whose thresholds have not.
The link between flower colour and pollinator vision has a long record. Chittka and Menzel [2] analysed 180 flower reflectance spectraDefinition: reflectance spectrum optics and visual ecology The share of light a surface reflects at each wavelength, here measured from 300 to 700 nm, which includes the ultraviolet below 400 nm. Excludes the colour a viewer sees, which also depends on the light and the eye. full definition and found that sharp steps in reflectance fall where bee-like insects discriminate best; their calculations of the best set of three receptors for telling flower colours apart matched the receptors measured in many Hymenoptera. Dorin, Shrestha, Garcia, Burd and Dyer [3] measured the surface set used here, flowers with rocks, minerals, bark and leaves from Australia, and found that the share of flowers with sharp spectral steps was an order of magnitude above the share among background samples. They argued that insect colour vision is older than flowers and was shaped by flight among rocks and plants, and that flowers evolved colours that stand out against that background.
This paper asks a narrower question that the model can answer directly. Among the pairs of surfaces a person cannot tell apart, does a modelled bee or blue tit tell apart flower-background pairs more often than background-background pairs? Searches we ran on 9 November 2026 found the work above and no direct count of this kind; that is what the searches returned, not proof that none exists.
Preregistration and design
The first study was written as a preregistrationDefinition: preregistration research method (metascience) A dated written plan for a study, fixed and hash-locked before any result is seen: the question, the data, the statistic, the controls, the forecasts and the kill conditions. Excludes a plan revised after looking at the outcome, and a protocol written only for the record after the run. full definition on 29 October 2026 and locked at 01:27:38 UTC on 30 October. Before the lock, the code was run only on scrambled data, with every spectrum permuted across wavelength and the group labels permuted, and only keys, counts and timings were printed. The model was checked against its published closed forms on random numbers, to 4 times 10 to the power -16. No statistic of a real spectrum seen through any observer was computed before the lock.
The locked file names the data, the observers and their noise values with a grade for each source, the model, the measures, the hypotheses with their pass rules and kill conditionsDefinition: kill condition research method (our usage, after Popper's falsification) A rule written in the preregistration that, when met, decides against the claim with no room for judgement after the run. Excludes reasons found after the run for setting a result aside. full definition, the controlsDefinition: control statistics and experimental design A version of the data with the structure under test removed (for example shuffled or pooled), scored the same way as the real data, so the real score has something to beat. Excludes a comparison with a different dataset or with a published number. full definition and the multiple-testing plan. This paper reports hypothesis H2, the flower test, with its secondary H2b and the instrument check V0. The same run tested other hypotheses about the information each observer carries; those are reported in the findings ledger and are not part of this paper.
H2 reads: among pairs one observer X cannot separate, the share another observer Y separates is larger for flower-background pairs than for background-background pairs. It was tested for four pairs of observers: human then bee, human then blue tit, dog then bee, and dog then blue tit. The kill condition: a ratio at or below 1, or inside the label-shuffle range. Each conditional share needs at least 20 pairs.
A second study, written after the first and locked at 02:40:37 UTC on 30 October, added photon noiseDefinition: photon noise physics of light detection The random variation in how many photons a receptor absorbs, which every real receptor has and which matters most when the catch is small. Added here as a term that falls with the catch. Excludes noise in the nerve cells after the receptors. full definition to the model, reran the instrument check, and repeated H2 on the first set and on a second set of surfaces. Its preregistration was hash-locked in the same way. Its result narrows this finding and is reported here as the replication.
Data and provenance
Set 1 is the 728 reflectance spectra of Dorin and colleagues [4], under CC0: 346 rocks and minerals, 96 bark, sticks and dry plant material, 65 green leaves, 153 insect-pollinated and 68 bird-pollinated flower petals, measured from 300 to 700 nm. The files were fetched from the Zenodo mirror of the Dryad deposit, because the Dryad file interface needed a token; the archive hashes equal those Dryad publishes.
Human cones are the CIE 2006 two-degree cone fundamentals, and the light is CIE standard illuminant D65, both under CC BY-SA 4.0 [5]. Bee, dog and blue tit receptor curves, blue tit ocular media and two natural lights come from the data inside the pavo 2.10.0 R package [6], under GPL version 2 or later; they were read with a pure-Python reader and no package code was run.
Set 2, used only in the replication, joins 512 flower spectra from Californian serpentine seeps (LeCroy and colleagues [7], CC0) with 41 eastern North American forest-floor backgrounds: 20 soils, 10 dry litter and 11 wet litter samples (Kraemer and Adams [8], CC0). Flowers and backgrounds come from different deposits and places.
Methods
The model
For a surface with reflectance under light , the quantum catchDefinition: quantum catch vision science The number of photons a receptor class absorbs from a surface, the sum over wavelength of reflectance times light times the receptor's sensitivity, here divided by the catch from a perfect white under the same light. Excludes the brightness a viewer reports. full definition of receptor class with sensitivity is
summed over wavelength in photon units. With von Kries adaptationDefinition: von Kries adaptation colour science Scaling each receptor class's catch by its catch from a white under the same light, a simple model of how eyes adjust to the colour of the light. Excludes adaptation that mixes signals between receptor classes. full definition, is divided by the catch from a perfect white, and the receptor signal is . For two surfaces, let be the difference in . For an observer with three receptor classes and noise , , , the colour distance in JND is
Two- and four-class observers use the general form of the same model [1]. Brightness differences are left out.
Noise
In the first study each receptor's noise is a Weber fractionDefinition: Weber fraction psychophysics and vision science The noise in one receptor class as a fixed share of its signal, the same at every light level. We call a model with only this noise the Weber model. Excludes photon noise, which grows in relative size as the catch falls. full definition, a fixed share of its signal. The human values are 0.063, 0.028 and 0.020 for the short, middle and long cones, from a long-cone fraction of 0.02 and relative cone densities of 1 to 5 to 10. The bee values are 0.13, 0.06 and 0.12. The blue tit uses 0.1 for its long-wave class with relative densities 0.37 to 0.70 to 0.99 to 1. The dog uses 0.05 for its long-wave class with densities 1 to 9. The preregistration grades these sources: the human densities and fraction are from memory with low confidence, the bee and blue tit values from memory of published sources with moderate confidence, and the dog value assumed.
The replication adds photon noise:
where is the Weber fraction above, the catch, and the photon catch from the white per receptor and integration time. is scaled by each class's relative density, with set to 10,000. That value is an order-of-magnitude memory with low confidence. Noise is evaluated at the mean catch of the pair.
The test statistic
A human-blind pairDefinition: human-blind pair our usage, after the metamer of colour science A pair of surfaces whose modelled colour distance for the human trichromat is at most 1 JND, so the model says a person cannot tell them apart by colour. Dog-blind pairs are defined the same way. Excludes pairs a person cannot tell apart by brightness, which the model does not test. full definition is a pair with for the human model. Among the human-blind pairs, let be the share of flower-background pairs with for the second observer, and the same share among background-background pairs. The separation ratioDefinition: separation ratio our usage Among pairs one observer cannot separate, the share of flower-background pairs a second observer separates divided by the share of background-background pairs it separates. 1 means flowers gain nothing over the background. Excludes how far apart the pairs are for the second observer. full definition is
Dog-blind pairs are treated the same way. Flower-flower pairs are not counted.
Secondary test and named examples
H2b compares, for each flower, the median bee distance to all backgrounds between insect- and bird-pollinatedDefinition: insect- and bird-pollinated pollination ecology The dataset's labels for flowers whose recorded pollinators are insects only or birds only. Excludes flowers visited by both, which the dataset does not include in these groups. full definition flowers, with a one-sided label-permutation p value. Named examples were listed among human-blind flower-background pairs, with each surface's UV shareDefinition: UV share our usage A surface's mean reflectance below 400 nm divided by its mean reflectance from 400 to 700 nm. Excludes whether the ultraviolet forms a pattern on the petal. full definition.
Instrument check
The instrument checkDefinition: instrument check our usage; a known-answer test of the model against behaviour A preregistered test in which the model must reproduce published behavioural measurements, here the smallest wavelength step each observer can detect. If it fails, only ranks and ratios from the model are used. Excludes a test of the model against its own output, and a planted check on synthetic data. full definition, V0, asks the model for the smallest step in wavelength between two pure spectral lights that reaches 1 JND, in steps of 0.1 nm. In the first study the human minimum had to lie between 0.5 and 5 nm and the bee minimum between 1.5 and 12 nm, against behavioural values of about 1 to 2 nm for people and 4 to 5 nm for bees. In the replication the rules were tightened to a factor of 2 of the behavioural values at named wavelengths, for example a human step between 3 and 12 nm at 640 nm and a bee minimum between 2.25 and 9 nm. The behavioural values come from secondary sources and memory; the primary papers were not in hand. If V0 fails, absolute sizes from the model are not used.
Controls and planted checks
The control for H2 is a label shuffleDefinition: label shuffle statistics (permutation test) A control that randomly reassigns the flower and background labels over the same surfaces, here 500 times, and recomputes the separation ratio, which shows how large it gets when the labels carry no meaning. Excludes a shuffle of the spectra themselves. full definition: the flower and background labels are permuted over the same surfaces 500 times and the ratio recomputed. The null distributionDefinition: null distribution statistics The spread of scores a control gives over many random draws. Its 95th percentile is the bar a real score must clear. Excludes a theoretical distribution assumed rather than drawn from the data. full definition of the ratio has a mean near 1, as it should. A real ratio must exceed the shuffle's 95th percentile. The p value from drawsDefinition: p value (from draws) statistics The share of control draws scoring at or above the real score, with one added to the count and to the number of draws, so it is never zero. Excludes a p value from a textbook formula that assumes a distribution. full definition is the share of shuffles at or above the real ratio, counted with one added to both counts, so with 500 draws the smallest possible value is 0.002. The p values were then put through the Benjamini-Hochberg correctionDefinition: Benjamini-Hochberg correction statistics, multiple testing A rule that adjusts a set of p values so that, among the tests called significant, the expected share of false calls stays at or below a chosen rate q, here 0.05. Excludes the stricter Bonferroni rule, which bounds the chance of any false call. full definition: over 7 tests in the first study and 14 in the replication.
- data728 and 553 measured surface spectraSet 1 has 221 flowers and 507 rocks, barks and leaves. Set 2 is a second collection of flowers with soil and leaf litter.
- measurementReceptor models for four observersEach spectrum becomes receptor signals for a human, a dog, a honeybee and a blue tit. The distance between two surfaces is counted in just-noticeable differences.
- measurementKeep the pairs the first observer cannot separatePairs under one just-noticeable difference for the human, or for the dog.
- measurementSeparation ratioShare of flower-background pairs the bee or blue tit separates, divided by the share of background-background pairs it separates.
- controlLabel shuffleFlower and background labels permuted over the same surfaces, 500 times. The shuffled ratio has a mean of 1.00.
- controlInstrument check against behaviourThe smallest wavelength step each model resolves must fall in the range measured in behaviour for humans and bees.
- rule set in advanceRule: ratio above the shuffle's 95th percentileSet before the run, with the p values corrected over all tests in each study.
- direction holds16 of 16 ratios passedInstrument check: failed with Weber noise, failed with photon noise added. The sizes are not claimed.
Read from result.json (first study), run 20261030T012757Z. SHA-256 of the run's file 23d4243438f4910141a40aefcc8a78484472b4c6bc01d4248661e07b81264b3e and of the published copy b0ec33628766e90a692c073202f2c2c6777f276ea2e6203bb595e118ba03da38. In the copy, file paths are cut to the file name and the layout (indentation, line endings) may differ; every value is the same.
Read from result.json (replication), run 20261030T024058Z. SHA-256 of the run's file 1d3200a0492db001538247dccfc319bd258c4ade68ac0e3b88c165dcec7c3bad and of the published copy 0841d2fd88a47e36509fef92964e268ed64742d076c1c4d98caf6fc57f0f75e6. In the copy, file paths are cut to the file name and the layout (indentation, line endings) may differ; every value is the same.
Two code checks stand in for a planted checkDefinition: planted check research method; called a positive control in experimental science Data built so that the right answer is known, run through the same analysis before the real data, to show that the analysis can see the effect when it is there. Excludes any check made on the real data, which cannot show what the analysis misses. full definition. The model's distances agreed with the published closed forms for two and three receptor classes to 4 times 10 to the power -16 on random inputs, and pavo's D65 equalled the CIE D65 to within 8 times 10 to the power -6. The instrument check is the known-answer test against behaviour. No surface set with a planted flower effect was run.
Results
The first study
Among pairs a modelled human cannot separate, modelled bees and blue tits separate flower-background pairs more often than background-background pairs, and the separation ratio exceeded its label-shuffle 95th percentile in every condition tested: two noise models on the first set, and two on a second set of Californian flowers against North American soil and leaf litter. In the first study, with Weber noise, the bee separated 0.98 of 1,108 human-blind flower-background pairs and 0.48 of 3,892 human-blind background pairs, a ratio of 2.04 against a shuffle 95th percentile of 1.08. The blue tit separated 0.99 against 0.45, a ratio of 2.22 against 1.09. Among dog-blind pairs the ratios were 1.45 for the bee and 1.16 for the blue tit, each above its shuffle percentile. All four had p 0.002 and passed the correction (Table 1).
separation ratio (higher: flowers stand out more), log scale
- measured ratio
- label shuffle, 5th to 95th percentile
- control mean
- no difference
Data behind chart 3 16 rows
| Condition | Observers | Flower-background pairs | Background pairs | Ratio | Shuffle mean | Shuffle 95th percentile | p | Verdict |
|---|---|---|---|---|---|---|---|---|
| Set 1, Weber noise | Bee, among human-blind pairs | 1,108 | 3,892 | 2.04 | 1.002 | 1.080 | 0.002 | pass |
| Set 1, Weber noise | Blue tit, among human-blind pairs | 1,108 | 3,892 | 2.22 | 1.002 | 1.091 | 0.002 | pass |
| Set 1, Weber noise | Bee, among dog-blind pairs | 14,166 | 21,257 | 1.45 | 1.000 | 1.033 | 0.002 | pass |
| Set 1, Weber noise | Blue tit, among dog-blind pairs | 14,166 | 21,257 | 1.16 | 1.001 | 1.017 | 0.002 | pass |
| Set 1, photon noise added | Bee, among human-blind pairs | 2,201 | 9,185 | 1.67 | 1.001 | 1.064 | 0.002 | pass |
| Set 1, photon noise added | Blue tit, among human-blind pairs | 2,201 | 9,185 | 1.50 | 0.999 | 1.045 | 0.002 | pass |
| Set 1, photon noise added | Bee, among dog-blind pairs | 16,557 | 26,035 | 1.38 | 1.001 | 1.030 | 0.002 | pass |
| Set 1, photon noise added | Blue tit, among dog-blind pairs | 16,557 | 26,035 | 1.14 | 1.000 | 1.012 | 0.002 | pass |
| Set 2, Weber noise | Bee, among human-blind pairs | 566 | 316 | 313 | 1.013 | 1.315 | 0.004 | pass |
| Set 2, Weber noise | Blue tit, among human-blind pairs | 566 | 316 | 52.3 | 1.019 | 1.258 | 0.004 | pass |
| Set 2, Weber noise | Bee, among dog-blind pairs | 2,750 | 570 | 15.0 | 1.000 | 1.075 | 0.002 | pass |
| Set 2, Weber noise | Blue tit, among dog-blind pairs | 2,750 | 570 | 2.40 | 0.999 | 1.049 | 0.002 | pass |
| Set 2, photon noise added | Bee, among human-blind pairs | 1,374 | 465 | 45.6 | 1.018 | 1.236 | 0.002 | pass |
| Set 2, photon noise added | Blue tit, among human-blind pairs | 1,374 | 465 | 3.85 | 1.017 | 1.207 | 0.002 | pass |
| Set 2, photon noise added | Bee, among dog-blind pairs | 3,071 | 595 | 9.80 | 1.000 | 1.064 | 0.002 | pass |
| Set 2, photon noise added | Blue tit, among dog-blind pairs | 3,071 | 595 | 2.37 | 1.001 | 1.050 | 0.002 | pass |
Read from result.json (first study), run 20261030T012757Z. SHA-256 of the run's file 23d4243438f4910141a40aefcc8a78484472b4c6bc01d4248661e07b81264b3e and of the published copy b0ec33628766e90a692c073202f2c2c6777f276ea2e6203bb595e118ba03da38. In the copy, file paths are cut to the file name and the layout (indentation, line endings) may differ; every value is the same.
Read from result.json (replication), run 20261030T024058Z. SHA-256 of the run's file 1d3200a0492db001538247dccfc319bd258c4ade68ac0e3b88c165dcec7c3bad and of the published copy 0841d2fd88a47e36509fef92964e268ed64742d076c1c4d98caf6fc57f0f75e6. In the copy, file paths are cut to the file name and the layout (indentation, line endings) may differ; every value is the same.
H2b passed for the bee: the median bee distance from a flower to the backgrounds was 9.47 JND for insect-pollinated flowers and 6.83 for bird-pollinated flowers (p 0.002). It is not specific to bees. The human model also separates insect-pollinated flowers more (13.7 against 9.4, p 0.010), and for the blue tit the order reverses (9.65 against 10.16, p 0.79).
The named examples show what the count is made of. A petal of Hypericum pygmaeum against a dry, thin brown leaf sits 0.63 JND apart for the human model and 22.4 for the bee, with a UV share of 0.70 for the petal and 0.00 for the leaf. The reverse also occurs. The red, bird-pollinated Calothamnus graniticus sits 0.63 JND from fuchsite and 0.71 from white opal for the bee, and about 30 for the human model.
The instrument check
A preregistered instrument check failed under both noise models: the model resolves finer wavelength steps than bees show in behaviour, so only the direction of the effect is claimed. With Weber noise the model's smallest step was 0.4 nm for the human, at 615 nm, and 0.3 nm for the bee, at 540 nm. Weber-only noise lets a receptor with a near-zero catch report changes that photon noise would bury. With photon noise the human minimum rose to 0.8 nm at 500 nm, which passes, but the human step at 640 nm was 2.2 nm against a required 3 to 12 nm. The bee minimum was 0.7 nm at 540 nm, outside both the required range and the required place. The model is still too fine for the bee.
| Check | Model value | Required | Result |
|---|---|---|---|
| Weber noise: Human, smallest step | 0.4 nm | 0.5 to 5 nm | out of range |
| Weber noise: Human, wavelength of the smallest step | 615 nm | 470 to 620 nm | in range |
| Weber noise: Bee, smallest step | 0.3 nm | 1.5 to 12 nm | out of range |
| Weber noise: Mantis shrimp, median step | 17.4 nm | at least 8 nm | in range |
| Photon noise added: Human, smallest step | 0.8 nm | 0.5 to 2 nm | in range |
| Photon noise added: Human, step at 500 nm | 0.8 nm | 0.5 to 2 nm | in range |
| Photon noise added: Human, step at 600 nm | 1.5 nm | 0.5 to 2 nm | in range |
| Photon noise added: Human, step at 640 nm | 2.2 nm | 3 to 12 nm | out of range |
| Photon noise added: Human, smallest step in the required place | yes | yes | in range |
| Photon noise added: Bee, smallest step | 0.7 nm | 2.25 to 9 nm | out of range |
| Photon noise added: Bee, smallest step in the required place | no | yes | out of range |
| Photon noise added: Mantis shrimp, median step | 17.4 nm | at least 8 nm | in range |
Data behind chart 4 12 rows
| Check | Model value | Required | Result |
|---|---|---|---|
| Weber noise: Human, smallest step | 0.4 nm | 0.5 to 5 nm | out of range |
| Weber noise: Human, wavelength of the smallest step | 615 nm | 470 to 620 nm | in range |
| Weber noise: Bee, smallest step | 0.3 nm | 1.5 to 12 nm | out of range |
| Weber noise: Mantis shrimp, median step | 17.4 nm | at least 8 nm | in range |
| Photon noise added: Human, smallest step | 0.8 nm | 0.5 to 2 nm | in range |
| Photon noise added: Human, step at 500 nm | 0.8 nm | 0.5 to 2 nm | in range |
| Photon noise added: Human, step at 600 nm | 1.5 nm | 0.5 to 2 nm | in range |
| Photon noise added: Human, step at 640 nm | 2.2 nm | 3 to 12 nm | out of range |
| Photon noise added: Human, smallest step in the required place | yes | yes | in range |
| Photon noise added: Bee, smallest step | 0.7 nm | 2.25 to 9 nm | out of range |
| Photon noise added: Bee, smallest step in the required place | no | yes | out of range |
| Photon noise added: Mantis shrimp, median step | 17.4 nm | at least 8 nm | in range |
Read from result.json (first study), run 20261030T012757Z. SHA-256 of the run's file 23d4243438f4910141a40aefcc8a78484472b4c6bc01d4248661e07b81264b3e and of the published copy b0ec33628766e90a692c073202f2c2c6777f276ea2e6203bb595e118ba03da38. In the copy, file paths are cut to the file name and the layout (indentation, line endings) may differ; every value is the same.
Read from result.json (replication), run 20261030T024058Z. SHA-256 of the run's file 1d3200a0492db001538247dccfc319bd258c4ade68ac0e3b88c165dcec7c3bad and of the published copy 0841d2fd88a47e36509fef92964e268ed64742d076c1c4d98caf6fc57f0f75e6. In the copy, file paths are cut to the file name and the layout (indentation, line endings) may differ; every value is the same.
The replication
The size of the ratio did not travel: for the bee it was 2.04 with Weber noise and 1.67 with photon noise added on the first set, and 45.6 on the second set, where the backgrounds are brown and alike. With photon noise on set 1, more pairs became human-blind (2,201 flower-background and 9,185 background pairs), and the bee separated 0.96 against 0.58 of them. The blue tit's ratio fell from 2.22 to 1.50. Every one of the 12 replication ratios exceeded its shuffle percentile and passed the correction, with p 0.002 to 0.004. Figure 2 draws all 16 ratios against their shuffle ranges.
On set 2 the bee separated 0.98 of 1,374 human-blind flower-background pairs and only 0.022 of 465 background pairs. The 41 background spectra are brown and alike, so a bee separates few background pairs a human confuses. There the ratio measures how uniform the backgrounds are as much as anything about flowers.
Discussion
The result agrees with Chittka and Menzel [2] and with Dorin and colleagues [3], who used this same surface set: flower colours stand apart from their backgrounds in ways insect vision can see. This paper puts a different number on it. Of the colour differences a person cannot see, a larger share falls between a flower and a background than between two backgrounds, for a modelled bee and a modelled blue tit. The control for chance holds that number up in every condition.
The size of the effect is a property of the model and the surfaces together. Photon noise made more pairs human-blind and cut the bee's ratio from 2.04 to 1.67. A second set of surfaces with uniform brown backgrounds pushed it to 45.6. None of these values is the ratio in a real meadow. The direction, flowers ahead of backgrounds, survived both changes, and that is the claim this paper makes.
The instrument check marks the limit. The model resolves wavelength steps finer than bees can in behaviour. A model that is too fine for the bee would separate pairs a real bee cannot, and we expect that error to raise both shares in the ratio. The shuffle shows that the labels carry the difference between the shares, but the absolute shares should not be read as what a bee sees. Each failed check here is an honest nullDefinition: honest null research method (our usage) A working test that found no effect beyond a stated bound, a forecast that failed, or an error of our own found and fixed, reported with the same weight as a positive result. Excludes a void run, and a result left unpublished because it was negative. full definition and is reported with the result.
H2b shows why care is needed with stories of design. Insect-pollinated flowers stand further from the backgrounds than bird-pollinated ones for the bee, and also for the human model. A colour that stands out for many eyes is not evidence of tuning to one.
Limitations
- The instrument check failed twice, with Weber noise and with photon noise, so the model is too fine for at least the bee. Only the direction of the ratio is claimed.
- Several receptor noise values come from memory or secondary sources, and the photon count is an order-of-magnitude memory. Absolute sizes depend on them.
- The model uses whole-surface spectra and ignores pattern, so nectar guides and other patterns inside one flower are out of reach.
- Backgrounds were not matched to each flower's own site, and set 2 joins flowers and backgrounds from different places. Two sets agreeing is not generality across the world's surfaces.
- Discrimination capacity in a model is not what the animal experiences, and no behaviour was tested.
- Dorin and colleagues studied flower signalling on set 1 before us, so set 1 was not a new sample for the general idea.
- The analysis was run by our own code and was not blind. For these reasons the finding is published at tierDefinition: tier our publication register How ready a finding is to publish: A candidate, B signal worth expanding (B* strong), C internal, D honest null worth reporting, E not reliable as it stands. Excludes a measure of how large or how true an effect is. full definition B, a signal worth expanding.
Evidence
Held. Real spectra and working shuffles, and the direction replicates on a second set. The instrument check failed in both runs, so only the direction of the ratios stands; their sizes do not carry over. Dorin and colleagues (2023) used the same data to study flower signalling.
Figures
These are the paper's own figures, numbered as in the PDF, and each "Figure" reference in the text points here. The charts on this page redraw the same results from the result files and carry their own numbers.
Tables
| Test and condition | FB pairs | BB pairs | Ratio | Shuffle q95 | p |
|---|---|---|---|---|---|
| Bee given human, set 1, Weber | 1,108 | 3,892 | 2.04 | 1.08 | 0.002 |
| Blue tit given human, set 1, Weber | 1,108 | 3,892 | 2.22 | 1.09 | 0.002 |
| Bee given dog, set 1, Weber | 14,166 | 21,257 | 1.45 | 1.03 | 0.002 |
| Blue tit given dog, set 1, Weber | 14,166 | 21,257 | 1.16 | 1.02 | 0.002 |
| Bee given human, set 1, photon | 2,201 | 9,185 | 1.67 | 1.06 | 0.002 |
| Blue tit given human, set 1, photon | 2,201 | 9,185 | 1.50 | 1.04 | 0.002 |
| Bee given dog, set 1, photon | 16,557 | 26,035 | 1.38 | 1.03 | 0.002 |
| Blue tit given dog, set 1, photon | 16,557 | 26,035 | 1.14 | 1.01 | 0.002 |
| Bee given human, set 2, photon | 1,374 | 465 | 45.6 | 1.24 | 0.002 |
| Blue tit given human, set 2, photon | 1,374 | 465 | 3.85 | 1.21 | 0.002 |
| Bee given dog, set 2, photon | 3,071 | 595 | 9.80 | 1.06 | 0.002 |
| Blue tit given dog, set 2, photon | 3,071 | 595 | 2.37 | 1.05 | 0.002 |
| Bee given human, set 2, Weber | 566 | 316 | 313 | 1.31 | 0.004 |
| Blue tit given human, set 2, Weber | 566 | 316 | 52.3 | 1.26 | 0.004 |
| Bee given dog, set 2, Weber | 2,750 | 570 | 15.0 | 1.08 | 0.002 |
| Blue tit given dog, set 2, Weber | 2,750 | 570 | 2.40 | 1.05 | 0.002 |
Appendix A. The preregistered verdicts
Each verdictDefinition: verdict research method (our usage) The pass or fail of one preregistered rule set against the run's numbers, read off by code. Excludes an interpretation written after reading the numbers. full definition is a set of rules written before the run, and it passes only when every rule holds. Values are read from the runs' result files.
| Verdict | Deciding rule | Value | Holds |
|---|---|---|---|
| H2, bee given human | ratio above 1 and above its shuffle 95th percentile (1.08), corrected | 2.04 | yes |
| H2, blue tit given human | ratio above 1 and above its shuffle 95th percentile (1.09), corrected | 2.22 | yes |
| H2, bee given dog | ratio above 1 and above its shuffle 95th percentile (1.03), corrected | 1.45 | yes |
| H2, blue tit given dog | ratio above 1 and above its shuffle 95th percentile (1.02), corrected | 1.16 | yes |
| H2b, bee | insect minus bird median distance above 0, one-sided p below 0.05 | 2.64; p 0.002 | yes |
| V0, first study | human minimum step 0.5 to 5 nm; bee minimum 1.5 to 12 nm | 0.4; 0.3 nm | no |
| V0, replication | every model step within a factor of 2 of behaviour at named wavelengths | human 2.2 nm at 640; bee 0.7 nm | no |
| H2 replication, 12 tests | each ratio above 1 and above its shuffle 95th percentile, corrected | 1.14 to 313 | yes, 12 of 12 |
Numbers recorded in our publication register
| What | Value |
|---|---|
| Sample | 728 surfaces (507 background, 221 flower); 1,108 flower-background and 3,892 background-background pairs for the bee given the human |
| Main estimate and interval | ratio 2.04 (shuffle 95th percentile 1.08, p 0.002); a side hypothesis on receptor overlap, rho 0.92 (shuffle 95th percentile 0.54) |
| Forecast against outcome | the main forecast, a ratio above 1, passed; the shade forecast came out reversed |
| Known-answer check | the instrument check failed: the modelled human and bee resolve wavelength steps of 0.4 and 0.3 nm, finer than behaviour shows; a coded mantis shrimp at 17.4 nm passed |
As recorded in the publication register, the summary row each finding gets; the paper's own numbers above were re-read from the result files.
What lowers it
- blinding Not blind. Two measures in a side hypothesis draw on the same partitions; some noise values were entered from memory. from our publication register, on blinding
- failed check Controls: the label shuffles worked; the instrument check failed; four side hypotheses failed: receptors tuned better than random placement, two on combining observers, and a larger shift for the bee under shade. from our publication register, on controls
- novelty Nearby work exists; novelty is not shown. from our publication register, on the literature
- depth of reading The cited literature was read at the level of abstracts, publisher pages and search summaries; full texts were not read. from the Verified section
What holds it up
- scoring Scored by code against rules fixed in advance. from our publication register, on who scored it
- preregistration Preregistered and hash-locked before the run (sha256 fec1f165). from the Reproduce section
- open data Public data. from our publication register, on the data licence
Where the claim stands
- lead
- hypothesis
- thesis
- conjecture
- theorem
- law candidate
- killed
A preregistration with pass-or-fail rules is on file, which this rung needs. The next rung needs a named rival reading beaten by a decisive observation, and none is on file. Tier B: Real spectra and working shuffles, and the direction replicates on a second set. The instrument check failed in both runs, so only the direction of the ratios stands; their sizes do not carry over. Dorin and colleagues (2023) used the same data to study flower signalling.
Trail
Versions
- v4 2026-11-14, this page corrected, 1 item; the PDF and its BuildTeX source are still paper version 1.0
- v3 2026-11-09, paper version 1.0, first published PDF sha256 43d4098cd03bf7bb
- v2 2026-10-30, dated correction, 1 item
- v1 2026-10-29, entered in the findings ledger
Corrections
2026-11-14 scope found by a review of the published pages
A review of the published page found the title and summary wider than the study. now The title said bees and birds; the observers are a modelled bee and a modelled blue tit, and no behaviour was tested. The summary said far more often, a size word, while only the direction of the ratio is claimed. Both now say so.
2026-10-30 scope found by a later study of ours
The replication run with photon noise lowered the set 1 ratios to 1.67 for the bee and 1.50 for the blue tit. now A later dated line in the findings ledger narrows the published claim to the direction of the effect, and this paper follows it.
Standing, and the ledger entries it rests on
2026-10-30 narrowed in part F88
Set by hand from findings ledger entry F88, dated 2026-10-30: size of the ratios and the gain from combining observers. Rests on findings ledger, F88 and Publication pass corrections 2026-11-09.
Each correction is a dated note; the findings ledger is never rewritten, and a note governs where it differs.
Ledger and version dates up to publication are local dates in US Pacific time. Clock times in the text are UTC, seven or eight hours ahead, so a lock or a run stamped just after midnight UTC belongs to the previous local day. Corrections from 14 November 2026 on are dated in UTC.
References
- Vorobyev, M. and Osorio, D. (1998). Receptor noise as a determinant of colour thresholds. Proceedings of the Royal Society B 265, 351-358. doi:10.1098/rspb.1998.0302 abstract or summary, 2026-11-09: abstracts, publisher pages and search summaries; full text not read used in Introduction, Methods
- Chittka, L. and Menzel, R. (1992). The evolutionary adaptation of flower colours and the insect pollinators' colour vision. Journal of Comparative Physiology A 171, 171-181. doi:10.1007/BF00188925 abstract or summary, 2026-11-09: abstracts, publisher pages and search summaries; full text not read used in Introduction, Discussion
- Dorin, A., Shrestha, M., Garcia, J. E., Burd, M. and Dyer, A. G. (2023). Ancient insect vision tuned for flight among rocks and plants underpins natural flower colour diversity. Proceedings of the Royal Society B 290, 20232018. doi:10.1098/rspb.2023.2018 abstract or summary, 2026-11-09: abstracts, publisher pages and search summaries; full text not read used in Introduction, Discussion
- Dorin, A., Shrestha, M., Garcia, J. E., Burd, M. and Dyer, A. G. Reflectance spectra of rocks, minerals, sticks, bark, leaves and bird- and insect-pollinated flower petals (data deposit). Dryad, doi:10.5061/dryad.fn2z34v2c; Zenodo mirror record 10641891. CC0. run here Licence: spectra CC0 (Dryad fn2z34v2c); CIE 2006 and D65 tables CC BY-SA 4.0; receptor curves from the pavo package, GPL 2 or later, used to compute statistics and not redistributed here used in Data and provenance
- CIE. CIE 2006 LMS cone fundamentals, 2 degree, and CIE standard illuminant D65. CIE datasets, doi:10.25039/CIE.DS.tijidesg. CC BY-SA 4.0. run here Licence: spectra CC0 (Dryad fn2z34v2c); CIE 2006 and D65 tables CC BY-SA 4.0; receptor curves from the pavo package, GPL 2 or later, used to compute statistics and not redistributed here used in Data and provenance
- pavo: perceptual analysis, visualization and organization of spectral colour data. R package version 2.10.0, internal data (receptor sensitivities, ocular media and illuminants). GPL version 2 or later. run here Licence: spectra CC0 (Dryad fn2z34v2c); CIE 2006 and D65 tables CC BY-SA 4.0; receptor curves from the pavo package, GPL 2 or later, used to compute statistics and not redistributed here used in Data and provenance
- LeCroy and colleagues. Flower reflectance spectra from Californian serpentine seeps. Dryad dataset v41ns1rtq, read through its Zenodo mirror. CC0. run here Licence: spectra CC0 (Dryad fn2z34v2c); CIE 2006 and D65 tables CC BY-SA 4.0; receptor curves from the pavo package, GPL 2 or later, used to compute statistics and not redistributed here used in Data and provenance
- Kraemer and Adams. Soil and leaf litter reflectance spectra. Dryad dataset 4dv78, read through its Zenodo mirror. CC0. run here Licence: spectra CC0 (Dryad fn2z34v2c); CIE 2006 and D65 tables CC BY-SA 4.0; receptor curves from the pavo package, GPL 2 or later, used to compute statistics and not redistributed here used in Data and provenance
Cited by later findings
- F88 narrowed in part, size of the ratios and the gain from combining observers, 2026-10-30 (record findings ledger, F88 and Publication pass corrections 2026-11-09). Under photon noise the set 1 ratios fall to 1.67 for the bee and 1.50 for the blue tit, and the gain from combining two observers, +0.39 and found after the fact, shrinks to a null. Publication carries the direction only.
Reproduce
Data
- Dorin, A., Shrestha, M., Garcia, J. Licence: spectra CC0 (Dryad fn2z34v2c); CIE 2006 and D65 tables CC BY-SA 4.0; receptor curves from the pavo package, GPL 2 or later, used to compute statistics and not redistributed here. https://doi.org/10.5061/dryad.fn2z34v2c
- CIE. Licence: spectra CC0 (Dryad fn2z34v2c); CIE 2006 and D65 tables CC BY-SA 4.0; receptor curves from the pavo package, GPL 2 or later, used to compute statistics and not redistributed here. https://doi.org/10.25039/CIE.DS.tijidesg
- pavo. Licence: spectra CC0 (Dryad fn2z34v2c); CIE 2006 and D65 tables CC BY-SA 4.0; receptor curves from the pavo package, GPL 2 or later, used to compute statistics and not redistributed here.
- LeCroy and colleagues. Licence: spectra CC0 (Dryad fn2z34v2c); CIE 2006 and D65 tables CC BY-SA 4.0; receptor curves from the pavo package, GPL 2 or later, used to compute statistics and not redistributed here.
- Kraemer and Adams. Licence: spectra CC0 (Dryad fn2z34v2c); CIE 2006 and D65 tables CC BY-SA 4.0; receptor curves from the pavo package, GPL 2 or later, used to compute statistics and not redistributed here.
Preregistration
sha256 fec1f1655ac86d3c16394e1947b9e2919225d9420680e5981e219f5a7f8fccd2
plan cc9c52ac2d9456618a10e1429f135574afe43466735b431b2ee002b6c9c6531f
Steps
- Data: download the Dorin and colleagues spectra from Dryad (or its Zenodo mirror), the CIE 2006 cone fundamentals and D65, and the pavo 2.10.0 receptor curves; for set 2, the LeCroy and colleagues flower spectra and the Kraemer and Adams soil and litter spectra.
- Resample every spectrum to 300 to 700 nm in 1 nm steps, compute catches with eq. 1 under D65 with von Kries adaptation, and distances with eq. 2 and its general form; for the replication, use the noise of eq. 3 with N 10,000.
- Mark pairs at or below 1 JND for the human (or dog), compute eq. 4 for the bee and the blue tit, and compare it with 500 label shuffles; correct the p values by Benjamini-Hochberg at q 0.05.
- First study: preregistration SHA-256 fec1f1655ac86d3c16394e1947b9e2919225d9420680e5981e219f5a7f8fccd2, plan SHA-256 cc9c52ac2d9456618a10e1429f135574afe43466735b431b2ee002b6c9c6531f, run 20261030T012757Z.
- Replication: preregistration SHA-256 54571ccf85df9f48772bd0d03446598c3aa08cbdde1c29c9e27592895662e45d, plan SHA-256 95ba3678d3e9a2b1a3579aa1d1b1522ba59c6b699bf91761621d341517475a54, run 20261030T024058Z.
Cost. The first run took 19.7 minutes of wall time on one desktop; the energy attributed to it by a CPU-share model, which is a model and not a measurement, was 1,645 J. The replication run took 7.3 minutes, with 1,995 J attributed the same way. The studies were not re-run for this paper.
Downloads
- Whitepaper, PDF F81.pdf, 594 KB
- BuildTeX source F81.bld, 38 KB
- Build receipt F81.buildtex.json, 1 KB
- BuildLang doc module doc.bld, 5 KB, imported by the source
The PDF is typeset by BuildTeX from F81.bld, which is written from the same source as this page. The receipt records the source's SHA-256 and the PDF's (43d4098cd03b), so anyone can rebuild it and compare. The copy here has its hidden author field blanked, as the site does for every file it publishes; blank the same field in a rebuild before comparing. The name stays on the first page.
Verified
Verified on 2026-11-09. On 9 November 2026 the 728 surfaces and their group counts, every flower-background and background share with its pair count, every ratio with its shuffle percentile and p value, the H2b medians and p values, the named example distances and UV shares, the instrument-check values under both noise models, the set 2 group counts and the photon count were re-read from the two runs' result files. They match the findings ledgerDefinition: findings ledger our records The append-only, dated list of every result we have recorded, numbered F1, F2 and on. Corrections are added as new dated lines and old entries are never rewritten. Excludes a curated list of successes. full definition, including the ledger's later line that the set 1 photon ratios are 1.67 and 1.50 and that publication carries the direction only. The SHA-256 of each preregistration matches the hash recorded in its result file. Both figures were drawn by a script that reads only those two files.
Not checked. The Calothamnus example, which the web write-up marked as not re-read, was re-read here from the first run's example list. The studies were not re-run for this paper. The literature in the introduction was found by searches run on 9 November 2026 and read at the level of abstracts, publisher pages and search summaries; the full texts were not read.
Terms on this page
Each term is defined where it is first used on this page. Each name below opens its entry in the findings glossary, which lists every page that uses it.
- receptor class vision science first use
- receptor-noise-limited model visual ecology first use
- just-noticeable difference (JND) psychophysics first use
- reflectance spectrum optics and visual ecology first use
- preregistration research method (metascience) first use
- kill condition research method (our usage, after Popper's falsification) first use
- control statistics and experimental design first use
- photon noise physics of light detection first use
- quantum catch vision science first use
- von Kries adaptation colour science first use
- Weber fraction psychophysics and vision science first use
- human-blind pair our usage, after the metamer of colour science first use
- separation ratio our usage first use
- insect- and bird-pollinated pollination ecology first use
- UV share our usage first use
- instrument check our usage; a known-answer test of the model against behaviour first use
- label shuffle statistics (permutation test) first use
- null distribution statistics first use
- p value (from draws) statistics first use
- Benjamini-Hochberg correction statistics, multiple testing first use
- planted check research method; called a positive control in experimental science first use
- honest null research method (our usage) first use
- tier our publication register first use
- verdict research method (our usage) first use
- findings ledger our records first use
To report an error, name the finding, the claim number and the source on the Work page, which gives the address. Accepted corrections join the Trail with their date.