
Findings F675 Plants, trees and earth, Method and statistics found 2026-11-02
A panel test read climate driving tree rings correctly, and our own rule still failed it
On 161 northern tree-ring sites a panel-wide lagged test pointed from summer temperature to ring width, the known direction, with a wide margin. Two of its locked checks missed their bars by less than 0.02, so by the rule we wrote first the method earned no standing in this round.
- Tier
- D, honest null
- Outcome
- prediction failed
- Rung
- none assigned
- Verdicts
- 9 passed, 3 failed
- Kill rule
- fired
- Corrections
- 2, latest 2026-11-14
- Version
- v3, 2026-11-14
- Redo it
- Reproduce
Download PDF 597 KB BuildTeX source F675.bld
What this means for a reader
A method that points the right way on real data has not yet shown it can be trusted, because it must also pass tests on built data where we choose the answer. Here a simple panel test pointed from summer to ring by a wide margin and reversed when time ran backwards, and still missed two of the checks we had fixed in advance, by less than two percentage points each. We report that as a failure, because a near miss promoted after the fact is how weak methods earn trust they have not earned.
Objection
The planted forward and reverse worlds used a positive prior-summer term, the wrong sign for most of these stands. The pass of the planted forward world at real strength is a pass on a world unlike the real one.
What would change the call. Our publication register records no condition that would raise or overturn this call.
From the paper's first stated limitation; our register records no separate objection.
Abstract
Tree rings and summer temperature give a causal-direction test with a known answer: warmth shapes the ring, and the ring has no meaningful effect on the weather. An earlier round on 135 European sites found that a site-by-site transfer entropy estimator could not tell the two directions apart. In this second round we read lagged Granger tests across a panel of 161 held-out ring-width chronologies at or above 55 degrees north, under a plan hash-locked before any ring series was set against climate. On the high-pass series the panel direction index was +1.206 (95% interval +0.871 to +1.591), against a far-pairing 95th percentile of +0.213. Reversing time flipped the index to -0.894. Rings predicted the next summer at 6.8 percent of sites, below the no-coupling world's 7.8 percent and above the 95th percentile of the far-site pairing control, 6.2 percent. Two binding first-difference checks failed by less than 0.02: the planted reverse world was called correctly at 58.4 percent of sites against a bar of 60 percent, and the shared-trend world's reverse rate was 0.117 against a limit of 0.10. The kill condition written before the run therefore fired, and the instrument earned no standing in this round. The real-data asymmetry is reported as an exploratory reading.
c1 observed, evidence for claim 1
- The numbers in claim 1
- +1.206; 95; +0.871; +1.591; +0.213 matches the result file, 2026-11-09
- Chart 1
- Which way does prediction run between summer temperature and tree rings?
- Basis
- observed: measured in this study, with a result file
c2 observed, evidence for claim 2
- The numbers in claim 2
- -0.894 matches the result file, 2026-11-09
- Chart 1
- Which way does prediction run between summer temperature and tree rings?
- Basis
- observed: measured in this study, with a result file
c5 observed, evidence for claim 5
- The numbers in claim 5
- 6.8; 7.8; 95; 6.2 matches the result file, 2026-11-09
- Chart 2
- At how many sites does one series predict the other?
- Basis
- observed: measured in this study, with a result file
c3 observed, evidence for claim 3
- The numbers in claim 3
- 0.02; 58.4; 60; 0.117; 0.10 matches the result file, 2026-11-09
- Chart 3
- Did the method pass its own checks on made-up worlds with a known answer?
- Basis
- observed: measured in this study, with a result file
Introduction
Methods that read causal direction from two time series are used across climate science and ecology, and Runge and colleagues [1] set out the conditions under which such readings can be trusted in the Earth sciences. A known-answer testDefinition: known-answer test measurement and method validation A test of a method on a case where the true answer is fixed by physics or by construction, so that any wrong reading is a fault of the method. Excludes agreement with another method, which can share the same fault. full definition asks a method to recover a direction that is fixed in advance. Summer warmth shapes ring width at cold sites, and a ring cannot set the next summer, so annual rings and summer temperature give one such test on public data.
The first round of this study, finding F132questioned, ran a nearest-neighbour transfer entropy estimator site by site on 135 European chronologies and failed: the two directions were detected at similar rates, time reversal made no difference, and a planted direction was misread at about half the sites. Its own account was low power at about 78 years of data and a ring-temperature correlation near 0.2.
This round changes that assumption. It reads the direction across a panelDefinition: panel statistics and econometrics A set of units, here tree-ring sites, each observed over time and analysed together so that one statistic summarises all of them. Excludes a verdict reached site by site, and a pooled regression that treats all years of all sites as one series. full definition of sites at once, where F132questioned asked each site for its own verdict. The tool is the Granger testDefinition: Granger test econometrics and time-series statistics A regression test of whether the past values of one series improve the prediction of another beyond that series' own past. Here an F test on lags 1 and 2. Excludes a test of same-year effects, and proof of a physical cause. full definition, the lagged regression test Granger introduced in 1969. Panel versions exist in econometrics: Dumitrescu and Hurlin [2] average per-unit Wald statistics into one panel test of non-causality. Our index is simpler and was written from that idea, not copied from their statistic: a mean difference of per-site z-scores, with its null drawn from far-site pairings.
Two parts of the literature bear on the design. Preprocessing can create or hide Granger causality. Florin and colleagues [3] reported spurious and missed causalities after filtering, Barnett and Seth [4] showed that Granger causality is unchanged by filtering in theory and that filtering in practice raises both error rates, and Anderson and colleagues [5] gave conditions under which filtering does and does not distort it. That is why the plan ran three preprocessing arms and why their disagreement matters. Second, the lag structure of boreal conifer growth is not simple. Tumajer and Lehejcek [6] found in white spruce a positive effect of summer temperature in the year of ring formation and a negative effect of the summer one year before, and Lloyd and colleagues [7] reported that the previous growing season's temperature and precipitation control growth at most of their interior Alaska sites. Our searches, run on 9 November 2026, found no panel Granger test of ring width against climate with planted worlds of known direction. That is a search result, not proof that none exists.
Preregistration and design
The plan was written as a preregistrationDefinition: preregistration research method (metascience) A dated written plan for a study, fixed and hash-locked before any result is seen: the question, the data, the statistic, the controls, the forecasts and the kill conditions. Excludes a plan revised after looking at the outcome, and a protocol written only for the record after the run. full definition and hash-locked on 2 November 2026 at 09:42:37 UTC. Before the lock, the only facts read from the new data were outcome-free: the site count, the regions, the blocks, the series lengths, the distance to the nearest climate cell and the species. No ring series had been correlated, regressed or tested against any climate series. The estimator had been tested on synthetic autoregressive series only.
The plan named the assumption it changed from F132questioned and split the instrument's job into two readings scored apart. The first is reverse-route exclusion: past rings carry no lagged route into next year's summer temperature at the strength of the observed same-year coupling. The second is the forward reading: past summers add to next year's ring beyond the ring's own past. The plan forecast that the forward reading would lack power.
The kill conditionDefinition: kill condition research method (our usage, after Popper's falsification) A rule written in the preregistration that, when met, decides against the claim with no room for judgement after the run. Excludes reasons found after the run for setting a result aside. full definition was written without room for judgement: if any binding checkDefinition: binding check research method, our usage A preregistered rule on a synthetic world that the instrument must pass before any reading of the real data counts. Under the kill condition a single failure removes all standing. Excludes power checks and limit checks, which were recorded but could not remove standing. full definition fails, or the reverse-route exclusion fails on real data, the instrument gets no standing and F132questioned's block on direction readings stands. Exclusion status needed every binding check and the exclusion rule to pass. Forward status needed, in addition, the planted forward world at real strength and the forward rule on real data.
One deviation was recorded before any result was seen. The first run stopped on a division by zero inside the precipitation arm, which is descriptive and decides no verdict. CRU precipitation at many of these cells is filled with climatology where stations are absent, and at four sites the June to August total is constant over the whole window. The fix returns a p value of 1 when the target's residual sum of squares is zero. No temperature series can reach that branch: temperature repeats for at most 2 years at any site. The plan, the verdicts and the seed were unchanged.
Data and provenance
Rings: standard ring-width chronologies from the International Tree-Ring Data Bank [8], held by NOAA's National Centers for Environmental Information as public data with a request to cite the contributors. The selection rule was fixed in the build script before the lock: standard chronologies with no earlywood, latewood or density keyword, latitude at or above 55 degrees north, outside longitudes 12 W to 45 E so that no site falls in F132questioned's European region, years 1901 to 2025 with at least 5 samples, and a longest gap-free run of at least 60 years. This gave 161 sites: 100 in Canada, 45 in Alaska and 16 in Asia, in 77 two-degree blocks, with series of 60 to 115 years and a median of 89. The species are mostly white spruce, Picea glauca.
Climate: June to August mean temperature of the ring's year from the nearest land cell of CRU TS 4.10 [9] [10], released under the Open Database License 1.0 with attribution to the Climatic Research Unit, University of East Anglia. The nearest cell lay a median of 16.8 km from the site and at most 31 km. June to August precipitation was run as a descriptive secondary target.
Methods
The Granger pair at each site
For ring width and summer temperature at one site, the climate-to-ring test compares the full regression
with the same regression without the two climate terms, by an F test on the same rows. The ring-to-climate test is the mirror, with the roles of and exchanged. Each p value becomes a z-scoreDefinition: z-score of a p value statistics The point of the standard normal distribution that leaves the p value above it, so that a smaller p gives a larger z. Here capped at 6. Excludes a standardised value of the data themselves. full definition, , where is the quantile function of the standard normal distribution, capped at 6. The site's direction statistic is
where is the forward (climate to ring) score and the reverse one.
The panel index
The panel direction indexDefinition: panel direction index time-series statistics, our usage The mean over sites of d, the z-score of the climate-to-ring Granger test minus that of the ring-to-climate test. Positive values point from summer temperature to ring width. Excludes a test of significance at any one site. full definition is the mean over the sites:
Its 95% interval is a block bootstrapDefinition: block bootstrap statistics An interval made by resampling whole 2 degree blocks of sites with replacement, here 2,000 times, so that neighbouring sites that share climate move together and the interval is not too narrow. Excludes a bootstrap over single sites, and a binomial interval that treats sites as independent. full definition over the 77 two-degree blocks with 2,000 resamples. The detection rateDefinition: detection rate statistics, our usage The share of sites at which the Granger test in one direction gives p 0.05 or below. For synthetic worlds it is averaged over the draws. Excludes a rate corrected for testing 161 sites. full definition in each direction is the share of sites with p 0.05 or below. The same-year correlation between ring and temperature is reported and gives no direction.
Three preprocessing arms
Each pair of series was analysed three ways: through a high-pass filterDefinition: high-pass filter signal processing A filter that keeps fast variation and removes slow trends. Here each series minus a Gaussian smooth of width 10 years, then scaled to unit variance. Excludes first differences, which are reported as a separate arm. full definition (the primary arm, as in F132questioned), as first differencesDefinition: first differences time-series statistics Each year's value minus the previous year's, a second way to remove slow trends that weights the fastest changes most. Excludes the high-pass filter, which removes trends by smoothing. full definition, and raw, scaled only. The raw arm is descriptive and shows what a shared trend does.
Synthetic worlds
Each world is built per site from iAAFT surrogatesDefinition: iAAFT surrogate time-series statistics, surrogate data A copy of a series built by repeated rounds of Fourier phase randomisation and rank reordering, so that it keeps both the original spectrum, and with it the autocorrelation, and the original set of values, while its timing against any other series is lost. Excludes a shuffle of single years, which destroys the autocorrelation. full definition of that site's own series, five draws per site. In the planted forward world a surrogate of the ring series receives the site's own climate:
At real strength is the larger of the site's absolute same-year correlation on the high-pass arm and 0.1. In the planted reverse world a surrogate of the climate series receives the ring:
with the same . The strong worlds use coefficients 0.6 and 0.3. In the no-coupling world both series are independent surrogates. In the common-driver world an autoregressive driver with coefficient 0.5 enters both series in the same year with weight . In the shared-trend world independent surrogates receive a common line and random walk before preprocessing.
For a world with a planted direction, direction accuracyDefinition: direction accuracy method validation, our usage The share of sites at which the sign of d matches the direction planted in a synthetic world. 0.5 is what a coin would give. Excludes whether the test at any site is significant. full definition is
where is the number of sites whose has the planted sign.
Far-site pairing and multiple testing
The far-site pairingDefinition: far-site pairing statistics, our usage A control in which each ring series is paired with the summer temperature of a random site at least 1,000 km away, so that real coupling is removed while both series keep their own form. Repeated 199 times. Excludes pairings with nearby sites, which share regional climate. full definition pairs each ring with the summer temperature of a random site at least 1,000 km away, 199 times, on the high-pass and first-difference arms. Every site had at least 65 partners at that distance. Its p value is the share of pairings at or above the real index:
with , so the floor is 0.005. That floor sits under 0.0083, the smallest threshold the Benjamini-Hochberg correctionDefinition: Benjamini-Hochberg correction statistics, multiple testing A rule that adjusts a set of p values so that, among the tests called significant, the expected share of false calls stays at or below a chosen rate, here 0.05. The adjusted value is called q. Excludes the stricter Bonferroni rule, which bounds the chance of any false call. full definition at 0.05 over six tests can need, a lesson from F132questioned, where 20 pairings left a floor too high to correct. The six family p values are the two pairing tests, the real reverse rate on each of two arms against a binomial 5 percent, and two sign tests on the planted worlds at real strength.
Controls and planted checks
Every controlDefinition: control statistics and experimental design A version of the data with the structure under test removed (for example shuffled or pooled), scored the same way as the real data, so the real score has something to beat. Excludes a comparison with a different dataset or with a published number. full definition and synthetic world ran in the same run as the real data. The planted checksDefinition: planted check research method; called a positive control in experimental science Data built so that the right answer is known, run through the same analysis before the real data, to show that the analysis can see the effect when it is there. Excludes any check made on the real data, which cannot show what the analysis misses. full definition were split by role in the plan.
Binding checks, any failure fatal:
- Planted reverse world seen, on the high-pass and first-difference arms: the upper end of its index interval below 0, and accuracy above 0.6.
- No-coupling world, on both arms: forward and reverse detection rates at or below 0.10, twice the nominal 0.05.
- Shared-trend world on first differences: both rates at or below 0.10.
Power and limit checks, recorded but not binding:
- Strong planted forward world seen on high-pass: interval lower end above 0, accuracy above 0.55.
- Planted forward world at real strength seen on high-pass: interval lower end above 0. Forecast to fail.
- Shared-trend world on high-pass: both rates at or below 0.10. Forecast to fail, since F132questioned saw 0.126 and 0.170.
- Common-driver world on high-pass: its index interval contains 0.
Real-data rules:
- Exclusion: real reverse rate at or below 0.10 on both arms, and the real index above the planted reverse world's upper interval end on both arms.
- Forward: real high-pass index above the pairing 95th percentile, with its interval lower end above 0. The same comparison on first differences.
The time-reversedDefinition: time reversal time-series analysis The same test run on both series read backwards in time. A method that reads direction from lag order should flip. Excludes a control on coupling strength. full definition real series were reported beside the rules and decide nothing.
Results
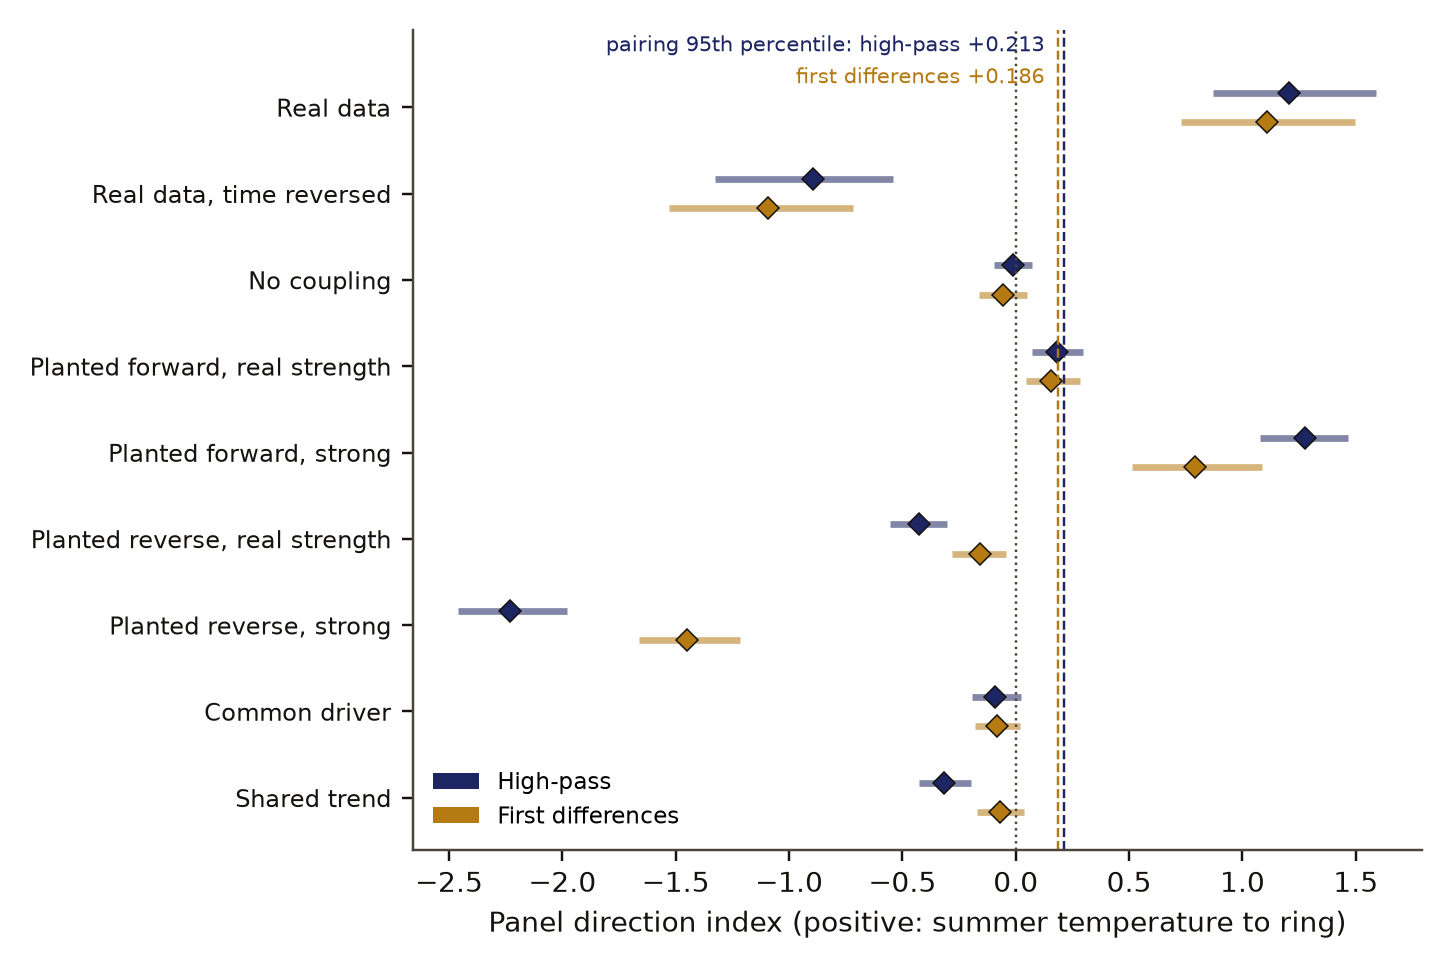
Table 1 gives the panel index and both detection rates in every world, and Figure 1 draws the index with its interval on the two binding arms. Synthetic worlds are averaged over five draws per site.
On the high-pass series the panel direction index was +1.206 (95% interval +0.871 to +1.591), against a far-pairing 95th percentile of +0.213. The pairing mean was +0.047 and its 5th percentile -0.099, and no pairing reached the real value, so p is 0.005, the floor at 199 pairings. First differences gave +1.107 against a pairing 95th percentile of +0.186 (p 0.005), and the raw series +1.242 (+0.873 to +1.655). Climate predicted next year's ring at 39.8 percent of sites. Rings predicted the next summer at 6.8 percent of sites, below the no-coupling world's 7.8 percent and above the 95th percentile of the far-site pairing control, 6.2 percent. The mean same-year correlation on the high-pass arm was 0.160, positive at 87.0 percent of sites.
direction index (above 0: temperature leads; below 0: ring leads)
- high-pass filtered
- first differences
- 95% interval from a block bootstrap (resampling whole two-degree blocks of sites) over the 77 blocks
- no direction, 0
Data behind chart 1 14 rows
| Filter | World | Index | Interval, low | Interval, high | Sites where temperature predicts ring, % | Sites where ring predicts temperature, % |
|---|---|---|---|---|---|---|
| High-pass filtered | Real rings and temperature | +1.206 | +0.871 | +1.591 | 39.8 | 6.8 |
| High-pass filtered | Real data with time reversed | −0.894 | −1.326 | −0.541 | 13.7 | 39.1 |
| High-pass filtered | Made-up world: no coupling | −0.011 | −0.095 | +0.073 | 5.5 | 7.8 |
| High-pass filtered | Made-up world: temperature leads, real strength | +0.180 | +0.073 | +0.296 | 10.4 | 5.2 |
| High-pass filtered | Made-up world: ring leads, real strength | −0.429 | −0.556 | −0.303 | 5.8 | 15.4 |
| High-pass filtered | Made-up world: shared trend only | −0.317 | −0.426 | −0.199 | 13.5 | 22.1 |
| First differences | Real rings and temperature | +1.107 | +0.729 | +1.496 | 36.0 | 6.2 |
| First differences | Real data with time reversed | −1.092 | −1.528 | −0.720 | 8.1 | 38.5 |
| First differences | Made-up world: no coupling | −0.055 | −0.164 | +0.048 | 6.6 | 7.2 |
| First differences | Made-up world: temperature leads, real strength | +0.155 | +0.045 | +0.285 | 12.3 | 9.6 |
| First differences | Made-up world: ring leads, real strength | −0.157 | −0.279 | −0.042 | 7.3 | 12.3 |
| First differences | Made-up world: shared trend only | −0.070 | −0.171 | +0.038 | 9.2 | 11.7 |
| High-pass filtered | Far-site pairing, 95th percentile | +0.213 | ||||
| First differences | Far-site pairing, 95th percentile | +0.186 |
Read from result.json, run 20261102T094346Z. SHA-256 of the run's file 61ea2ec9829044fa56dde1110302cd4f7714471194e57a90d4ea04f6dd2f3d93 and of the published copy e4cd84ba57bc0e04b6427cad7d8ebf1c87122af0f98ebd844eaa11c5bee56e65. In the copy, file paths are cut to the file name and the layout (indentation, line endings) may differ; every value is the same.
Reversing time flipped the index to -0.894. On first differences it flipped to -1.092 and on the raw series to -1.041. The shared trend pushed the high-pass index negative (-0.317) and the raw index further (-0.744, with rates 0.335 and 0.594), and the common driver gave -0.090 with an interval across zero. Neither confound produced a positive index like the real one.
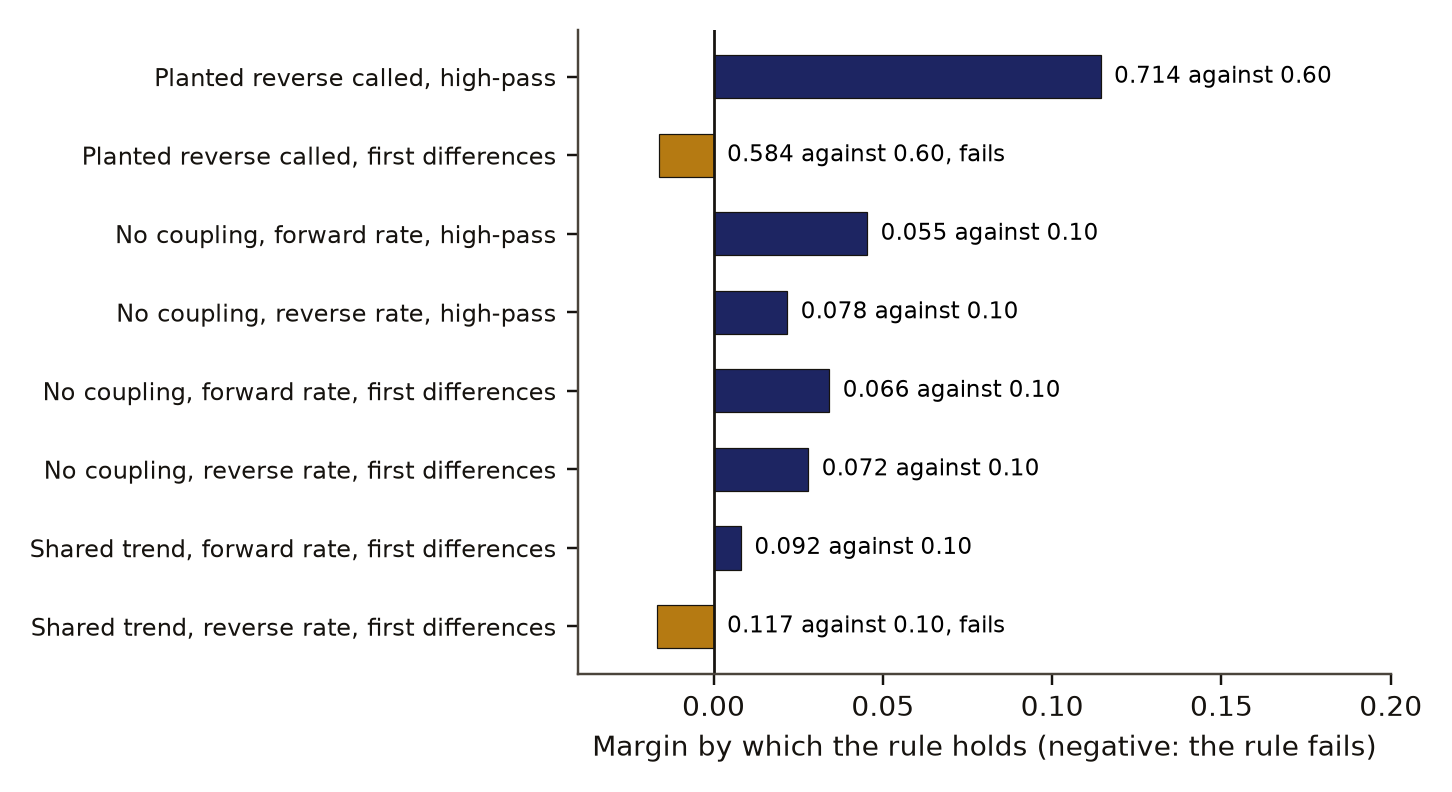
Figure 2 sets every binding rule against its bar.
Two binding first-difference checks failed by less than 0.02: the planted reverse world was called correctly at 58.4 percent of sites against a bar of 60 percent, and the shared-trend world's reverse rate was 0.117 against a limit of 0.10. Every high-pass binding check passed: the planted reverse world was called at 71.4 percent with its interval upper end at -0.303, and the no-coupling rates were 0.055 and 0.078. Every real-data rule passed, the power checks passed, including the planted forward world at real strength (interval lower end +0.073), and the shared-trend limit on high-pass failed as forecast (0.135 and 0.221). Under the kill condition one binding failure is enough. The instrument gets no standing from this round.
| Rule set in advance | Value | Bar | Result |
|---|---|---|---|
| Ring-leads world, high-pass: interval top below 0 | −0.30 | below 0 | held |
| Ring-leads world, high-pass: direction right at over 60% of sites | 71.4% | above 60% | held |
| Ring-leads world, first differences: interval top below 0 | −0.04 | below 0 | held |
| Ring-leads world, first differences: direction right at over 60% of sites | 58.4% | above 60% | failed |
| No-coupling world, high-pass: temperature-predicts-ring rate | 5.5% | at most 10% | held |
| No-coupling world, high-pass: ring-predicts-temperature rate | 7.8% | at most 10% | held |
| No-coupling world, first differences: temperature-predicts-ring rate | 6.6% | at most 10% | held |
| No-coupling world, first differences: ring-predicts-temperature rate | 7.2% | at most 10% | held |
| Shared-trend world, first differences: temperature-predicts-ring rate | 9.2% | at most 10% | held |
| Shared-trend world, first differences: ring-predicts-temperature rate | 11.7% | at most 10% | failed |
Data behind chart 3 24 rows
| Check | Rule | Measured | Bar | Held |
|---|---|---|---|---|
| A_rev_hp | analysis.rev_m_hp.ci_d.1 < 0 | −0.3031 | 0 | yes |
| A_rev_hp | analysis.rev_m_hp.accuracy > 0.6 | 0.7143 | 0.6 | yes |
| A_rev_diff | analysis.rev_m_diff.ci_d.1 < 0 | −0.0423 | 0 | yes |
| A_rev_diff | analysis.rev_m_diff.accuracy > 0.6 | 0.5839 | 0.6 | no |
| A_null_hp | analysis.null_hp.fwd_rate <= 0.1 | 0.0547 | 0.1 | yes |
| A_null_hp | analysis.null_hp.rev_rate <= 0.1 | 0.0783 | 0.1 | yes |
| A_null_diff | analysis.null_diff.fwd_rate <= 0.1 | 0.0658 | 0.1 | yes |
| A_null_diff | analysis.null_diff.rev_rate <= 0.1 | 0.0720 | 0.1 | yes |
| A_trend_diff | analysis.trend_diff.fwd_rate <= 0.1 | 0.0919 | 0.1 | yes |
| A_trend_diff | analysis.trend_diff.rev_rate <= 0.1 | 0.1168 | 0.1 | no |
| A_true_s_hp | analysis.true_s_hp.ci_d.0 > 0 | 1.0792 | 0 | yes |
| A_true_s_hp | analysis.true_s_hp.accuracy > 0.55 | 0.8944 | 0.55 | yes |
| A_true_m_hp | analysis.true_m_hp.ci_d.0 > 0 | 0.0725 | 0 | yes |
| T_trend_hp | analysis.trend_hp.fwd_rate <= 0.1 | 0.1354 | 0.1 | no |
| T_trend_hp | analysis.trend_hp.rev_rate <= 0.1 | 0.2211 | 0.1 | no |
| Hc_common_hp | analysis.common_hp.ci_d.0 < 0 | −0.1930 | 0 | yes |
| Hc_common_hp | analysis.common_hp.ci_d.1 > 0 | 0.0231 | 0 | yes |
| K_excl | analysis.real_hp.rev_rate <= 0.1 | 0.0683 | 0.1 | yes |
| K_excl | analysis.real_diff.rev_rate <= 0.1 | 0.0621 | 0.1 | yes |
| K_excl | analysis.real_hp.mean_d > analysis.rev_m_hp.ci_d.1 | 1.2062 | -0.3030847147837868 | yes |
| K_excl | analysis.real_diff.mean_d > analysis.rev_m_diff.ci_d.1 | 1.1069 | -0.042270183406282275 | yes |
| K_forward | analysis.real_hp.mean_d > controls.pair_hp.q95 | 1.2062 | 0.2129021274735547 | yes |
| K_forward | analysis.real_hp.ci_d.0 > 0 | 0.8711 | 0 | yes |
| K_forward_diff | analysis.real_diff.mean_d > controls.pair_diff.q95 | 1.1069 | 0.18644485412694106 | yes |
Read from result.json, run 20261102T094346Z. SHA-256 of the run's file 61ea2ec9829044fa56dde1110302cd4f7714471194e57a90d4ea04f6dd2f3d93 and of the published copy e4cd84ba57bc0e04b6427cad7d8ebf1c87122af0f98ebd844eaa11c5bee56e65. In the copy, file paths are cut to the file name and the layout (indentation, line endings) may differ; every value is the same.
The values over the six-test family, corrected by Benjamini and Hochberg, rejected both pairing tests (q 0.0086 each), the reverse-world sign test (q 1.6e-7) and the forward-world sign test (q 0.0086). The real reverse rates against 5 percent were not rejected (q 0.22 on high-pass, 0.29 on first differences). The binomial tests treat sites as independent; the block intervals carry the spatial dependence.
Table 3 in Appendix A sets the forecasts written before the run against the outcomes. The forecasts for the forward signal were far off. They leaned on F132questioned's forward rate of 0.089 in its variant without the same-year term, and on synthetic smoke tests (short trial runs that check the code executes) in which a positive planted prior-summer term was absorbed by the ring's own past.
Discussion
On the high-pass arm the panel test did what F132questioned's estimator could not. It pointed from summer to ring on sites the first round never touched, reversed with time, kept the reverse rate at the no-coupling level, and stayed clear of what a shared trend or a common driver produce. Read alone, that is a working instrument. It is not credited here, because the plan made two first-difference checks binding and both failed. This is an honest nullDefinition: honest null research method (our usage) A working test that found no effect beyond a stated bound, a forecast that failed, or an error of our own found and fixed, reported with the same weight as a positive result. Excludes a void run, and a result left unpublished because it was negative. full definition about the instrument as locked, and the real-data asymmetry stays exploratory.
The failures say something about first differences. Differencing weights the fastest changes, and in the planted reverse world it shrank the index from -0.429 to -0.157 and the accuracy from 0.714 to 0.584. Smoke tests before the lock had already shown the first-difference arm weaker against the reverse world, and the plan made it binding anyway. That is a design error of ours. It agrees in kind with the filtering literature, where preprocessing can raise both error rates of a Granger test [4] [3] [5].
A look after the run, which is exploratory and not a result, explains why the forward signal was so much larger than forecast. Regressing ring on same-year and prior-year summer temperature on the high-pass arm, without the ring's own past, gave a same-year slope with median +0.170, positive at 88.8 percent of sites, and a prior-summer coefficientDefinition: prior-summer coefficient dendroclimatology The slope on the previous year's summer temperature in a regression of this year's ring width on this year's and last year's summer temperature. Excludes the same-year slope, and any effect of the ring's own past unless it is added to the regression. full definition with median -0.127. The planted forward effect carried a positive prior-summer term, and the real prior-summer coefficient was negative at most sites (median -0.127, positive at 21.7 percent). Its size was a median of 0.76 times the same-year term, and with the ring's own past added the median grew to -0.173. The inference, not tested here, is that a negative lag-one term adds to the Granger signal where a positive one is absorbed by the ring's own past. The planted world at real strength was then not at the real lag structure, and the same error sat in F132questioned. A negative effect of the previous summer in white spruce is reported in the literature [6] [7].
c4 inferred, evidence for claim 4
- The numbers in claim 4
- -0.127; 21.7 matches the result file, 2026-11-09
- Chart 4
- A warm summer goes with a wider ring that year and a narrower ring the next.
- Basis
- inferred: argued on this page from the observed results
The real index (+1.206) sits close to the strong planted forward world (+1.274) and far from the one at real strength (+0.180), which fits that reading.
A third round, finding F676, ran the same day on 145 further held-out sites with the planted prior-summer term fitted to the measured sign and only the high-pass arm binding. It gave a panel index of +1.204 against a pairing 95th percentile of +0.461, passed every binding check but one, and its kill condition did not fire, so the panel method gained a limited direction status at that coupling strength. That later result does not change this round's verdictDefinition: verdict research method (our usage) The pass or fail of one preregistered rule set against the run's numbers, read off by code. Excludes an interpretation written after reading the numbers. full definition.
Limitations
- The planted forward and reverse worlds used a positive prior-summer term, the wrong sign for most of these stands. The pass of the planted forward world at real strength is a pass on a world unlike the real one.
- Both failed checks are ours: we made the first-difference arm binding when smoke tests had shown it weaker.
- CRU temperature at these latitudes rests on few stations before about 1950, a recalled fact held with high confidence and not checked for this paper. CRU precipitation is filled with climatology at many cells, so the precipitation arm says little.
- 145 of the 161 sites are in Alaska and Canada, in 77 blocks. The block intervals carry that clustering; the binomial p values do not.
- Lag tests cannot see a same-year reverse effect. The known answer's reverse half, that a ring does not change the next summer, is taken as given.
- Results concern annual ring width at high-latitude conifer sites with lags of 1 and 2 years. A Granger pass says that one series improves the prediction of the other, and makes no claim about physical cause.
- Scoring was done by our own code, the second reading of the results was done by the same reviewer who ran the analysis, and the analysis was not blind.
Evidence
Prediction failed. Two binding first-difference checks failed by less than 0.02, so the preregistered kill fired and the panel instrument earned no standing in this round.
Figures
These are the paper's own figures, numbered as in the PDF, and each "Figure" reference in the text points here. The charts on this page redraw the same results from the result files and carry their own numbers.
Tables
| World | High-pass index | Rates | First-difference index | Rates |
|---|---|---|---|---|
| Real data | +1.206 (+0.871 to +1.591) | 0.398, 0.068 | +1.107 (+0.729 to +1.496) | 0.360, 0.062 |
| Real, time reversed | -0.894 (-1.326 to -0.541) | 0.137, 0.391 | -1.092 (-1.528 to -0.720) | 0.081, 0.385 |
| No coupling | -0.011 (-0.095 to +0.073) | 0.055, 0.078 | -0.055 (-0.164 to +0.048) | 0.066, 0.072 |
| Planted forward, real strength | +0.180 (+0.073 to +0.296) | 0.104, 0.052 | +0.155 (+0.045 to +0.285) | 0.123, 0.096 |
| Planted forward, strong | +1.274 (+1.079 to +1.465) | 0.402, 0.061 | +0.789 (+0.512 to +1.088) | 0.404, 0.176 |
| Planted reverse, real strength | -0.429 (-0.556 to -0.303) | 0.058, 0.154 | -0.157 (-0.279 to -0.042) | 0.073, 0.123 |
| Planted reverse, strong | -2.230 (-2.458 to -1.978) | 0.086, 0.740 | -1.448 (-1.662 to -1.218) | 0.096, 0.507 |
| Common driver | -0.090 (-0.193 to +0.023) | 0.061, 0.067 | -0.082 (-0.181 to +0.019) | 0.075, 0.086 |
| Shared trend | -0.317 (-0.426 to -0.199) | 0.135, 0.221 | -0.070 (-0.171 to +0.038) | 0.092, 0.117 |
| Precipitation, descriptive | +0.344 (+0.059 to +0.664) | 0.174, 0.043 | +0.071 (-0.182 to +0.333) | 0.143, 0.081 |
Appendix A. The preregistered verdicts and forecasts
Each verdict is a set of rules written before the run. A verdict passes only when every rule holds. Values are read from the run's result file.
| Verdict | Role | Deciding rule | Value, holds |
|---|---|---|---|
| Planted reverse, high-pass | binding | index interval upper end below 0; accuracy above 0.6 | -0.303 yes; 0.714 yes |
| Planted reverse, first differences | binding | index interval upper end below 0; accuracy above 0.6 | -0.042 yes; 0.584 no |
| No coupling, high-pass | binding | forward and reverse rates at most 0.10 | 0.055 and 0.078, yes |
| No coupling, first differences | binding | forward and reverse rates at most 0.10 | 0.066 and 0.072, yes |
| Shared trend, first differences | binding | forward and reverse rates at most 0.10 | 0.092 yes; 0.117 no |
| Strong planted forward, high-pass | power | index interval lower end above 0; accuracy above 0.55 | +1.079 yes; 0.894 yes |
| Planted forward at real strength | power | index interval lower end above 0 | +0.073, yes |
| Shared trend, high-pass | limit | forward and reverse rates at most 0.10 | 0.135 and 0.221, no, as forecast |
| Common driver, high-pass | limit | index interval contains 0 | -0.193 to +0.023, yes |
| Exclusion | real data | reverse rate at most 0.10 on both arms; real index above planted reverse upper end on both arms | 0.068 and 0.062; +1.206 and +1.107, yes |
| Forward, high-pass | real data | index above pairing 95th percentile (+0.213); interval lower end above 0 | +1.206; +0.871, yes |
| Forward, first differences | real data | index above pairing 95th percentile (+0.186) | +1.107, yes |
| Decision | kill condition | any binding check failing means no standing | two failed; no standing |
Table 3 sets the forecasts fixed in the preregistration against the outcomes.
| Quantity | Forecast | Outcome |
|---|---|---|
| Mean same-year correlation, high-pass | 0.15 (0.05 to 0.25) | 0.160 |
| Share of sites with positive correlation | 0.70 | 0.870 |
| Real forward rate, high-pass | 0.09 (0.05 to 0.15) | 0.398 |
| Real reverse rate, high-pass | 0.07 (0.03 to 0.11) | 0.068 |
| Real index, high-pass | -0.05 (-0.30 to +0.20) | +1.206 |
| Planted reverse index, high-pass | -0.6 (-1.2 to -0.3) | -0.429 |
| Planted reverse accuracy, high-pass | 0.68 | 0.714 |
| Pairing 95th percentile, high-pass | +0.15 | +0.213 |
| Both planted reverse checks pass | probability 0.85 | failed |
| Shared trend, first differences, passes | probability 0.75 | failed |
| Exclusion rule passes | probability 0.60 | passed |
| Forward rule passes | probability 0.15 | passed |
| Planted forward at real strength seen | probability 0.10 | passed |
| Exclusion status granted | probability 0.30 | not granted |
| Forward status granted | probability 0.03 | not granted |
What lowers it
- blinding Not blind, as the paper's limitations state. from the paper's Limitations
- depth of reading The cited literature was read at the level of abstracts, publisher pages and search summaries; full texts were not read. from the Verified section
What holds it up
- preregistration Preregistered and hash-locked before the run (sha256 a2f1dd47). from the Reproduce section
Where the claim stands
Our register assigns this finding no rung on the ladder. Its entry describes the study as: preregistered, public data, known-answer instrument test.
Trail
Versions
- v3 2026-11-14, this page corrected, 1 item; the PDF and its BuildTeX source are still paper version 1.0
- v2 2026-11-09, paper version 1.0, first published PDF sha256 34e06fece9f50b48
- v1 2026-11-02, entered in the findings ledger
Corrections
2026-11-14 scope found by a review of the published pages
A review of the published page found the reverse rate compared with one control only. now Rings predicted the next summer at 6.8 percent of sites; that is below the no-coupling world's 7.8 percent and above the far-site pairing control's 95th percentile of 6.2 percent, and the text now gives both.
2026-11-02 number found by the study itself, before publication
The preregistration gave a smoke-test range of -0.31 to +0.12 for the planted forward index at real strength, which mixed high-pass and first-difference rows; the high-pass range alone is -0.14 to +0.12. now Stated in the results report; the preregistration is unchanged.
Standing, and the ledger entries it rests on
2026-11-02 narrowed in part F676
Set by hand from findings ledger entry F676, dated 2026-11-02: the exploratory negative prior-summer term. Rests on findings ledger, F676.
Each correction is a dated note; the findings ledger is never rewritten, and a note governs where it differs.
Ledger and version dates up to publication are local dates in US Pacific time. Clock times in the text are UTC, seven or eight hours ahead, so a lock or a run stamped just after midnight UTC belongs to the previous local day. Corrections from 14 November 2026 on are dated in UTC.
References
- Runge, J., Bathiany, S., Bollt, E. and others (2019). Inferring causation from time series in Earth system sciences. Nature Communications 10, 2553. doi:10.1038/s41467-019-10105-3 abstract or summary, 2026-11-09: abstracts, publisher pages and search summaries; full text not read used in Introduction
- Dumitrescu, E.-I. and Hurlin, C. (2012). Testing for Granger non-causality in heterogeneous panels. Economic Modelling 29(4), 1450-1460. doi:10.1016/j.econmod.2012.02.014 abstract or summary, 2026-11-09: abstracts, publisher pages and search summaries; full text not read used in Introduction
- Florin and colleagues (2010). The effect of filtering on Granger causality based multivariate causality measures. NeuroImage. abstract or summary, 2026-11-09: abstracts, publisher pages and search summaries; full text not read used in Introduction, Discussion
- Barnett, L. and Seth, A. K. (2011). Behaviour of Granger causality under filtering: theoretical invariance and practical application. Journal of Neuroscience Methods 201(2), 404-419. doi:10.1016/j.jneumeth.2011.08.010 abstract or summary, 2026-11-09: abstracts, publisher pages and search summaries; full text not read used in Introduction, Discussion
- Anderson and colleagues (2019). On the sensitivity of Granger causality to errors-in-variables, linear transformations and subsampling. Journal of Time Series Analysis. Open access, PubMed Central PMC7814891. abstract or summary, 2026-11-09: abstracts, publisher pages and search summaries; full text not read used in Introduction, Discussion
- Tumajer, J. and Lehejcek, J. (2019). Boreal tree-rings are influenced by temperature up to two years prior to their formation: a trade-off between growth and reproduction? Environmental Research Letters 14(12), 124024. doi:10.1088/1748-9326/ab5134 abstract or summary, 2026-11-09: abstracts, publisher pages and search summaries; full text not read used in Introduction, Discussion
- Lloyd and colleagues (2013). Nonlinear responses of white spruce growth to climate variability in interior Alaska. Reprint held by the USDA Forest Service, Pacific Northwest Research Station. abstract or summary, 2026-11-09: abstracts, publisher pages and search summaries; full text not read used in Introduction, Discussion
- International Tree-Ring Data Bank. NOAA National Centers for Environmental Information, World Data Service for Paleoclimatology. Ring-width chronologies. https://www.ncei.noaa.gov/pub/data/paleo/treering/ run here Licence: as stated in the paper's data section used in Data and provenance
- Harris, I., Osborn, T. J., Jones, P. and Lister, D. (2020). Version 4 of the CRU TS monthly high-resolution gridded multivariate climate dataset. Scientific Data 7, 109. doi:10.1038/s41597-020-0453-3 run here Licence: as stated in the paper's data section used in Data and provenance
- Climatic Research Unit, University of East Anglia. CRU TS 4.10 monthly temperature and precipitation, 0.5 degree. Open Database License 1.0. https://crudata.uea.ac.uk/cru/data/hrg/ run here Licence: as stated in the paper's data section used in Data and provenance
- F132questioned Transfer entropy could not tell which way climate and tree rings are linked run here listed, not cited in the text
Cited by later findings
- F676 narrowed in part, the exploratory negative prior-summer term, 2026-11-02 (record findings ledger, F676). On a third held-out panel the negative prior-summer term is species-dependent, not a panel result; the same instrument passes every binding verdict but one there.
Standing of findings cited here
- F132questioned held by F675, no direction-reading status, 2026-11-02 (record findings ledger, F675). On 161 held-out boreal sites the panel instrument's kill fired too; F132's block on direction readings stands.
- F132questioned questioned by F675, account of the planted lag-1 arm, 2026-11-02 (record findings ledger, F675). Exploratory and post hoc: a negative prior-summer term adds to the Granger signal, so F132's absorption account holds only for same-sign terms, and its planted arm had the wrong sign for these stands.
- F132questioned extended by F676, direction on rings, read on a panel, 2026-11-02 (record findings ledger, F676). A third round on 145 new sites: the lagged panel instrument passes every binding verdict but one and earns exclusion and forward status at that coupling strength.
Reproduce
Data
- International Tree-Ring Data Bank. Licence: as stated in the paper's data section. https://www.ncei.noaa.gov/pub/data/paleo/treering/
- Harris 2020. Licence: as stated in the paper's data section. https://doi.org/10.1038/s41597-020-0453-3
- cruts. Licence: as stated in the paper's data section. https://crudata.uea.ac.uk/cru/data/hrg/
Preregistration
sha256 a2f1dd47e803bf92b5d078f7845554df1f75e9ca8274805cc2049a5d099319ae
plan 784d61f1c10e5d428ce7ad318d856f1aa9f591c24436a6d9b643e8791eb2e2c8
Steps
- Data: ITRDB standard ring-width chronologies at or above 55 N, outside 12 W to 45 E, years 1901 to 2025 with at least 5 samples and a gap-free run of at least 60 years; June to August temperature from the nearest CRU TS 4.10 land cell.
- Preprocess both series three ways: high-pass with a 10-year Gaussian and scaling, first differences, and scaling only.
- At each site run eq. 1 both ways with lags 1 and 2, convert the p values to z-scores capped at 6, and form eq. 2; average by eq. 3 with a block bootstrap over two-degree blocks.
- Build the synthetic worlds of eqs. 4 and 5 and the no-coupling, common-driver and shared-trend worlds from five iAAFT draws per site; score eq. 6; run 199 far-site pairings and eq. 7.
- Preregistration SHA-256: a2f1dd47e803bf92b5d078f7845554df1f75e9ca8274805cc2049a5d099319ae. Plan SHA-256: 784d61f1c10e5d428ce7ad318d856f1aa9f591c24436a6d9b643e8791eb2e2c8. Run 20261102T094346Z. Result file SHA-256: 61ea2ec9829044fa56dde1110302cd4f7714471194e57a90d4ea04f6dd2f3d93.
Cost. The analysis took 131 seconds and the two pairing controls 31 and 33 seconds on one desktop CPU. The study was not re-run.
Downloads
- Whitepaper, PDF F675.pdf, 597 KB
- BuildTeX source F675.bld, 42 KB
- Build receipt F675.buildtex.json, 1 KB
- BuildLang doc module doc.bld, 5 KB, imported by the source
The PDF is typeset by BuildTeX from F675.bld, which is written from the same source as this page. The receipt records the source's SHA-256 and the PDF's (34e06fece9f5), so anyone can rebuild it and compare. The copy here has its hidden author field blanked, as the site does for every file it publishes; blank the same field in a rebuild before comparing. The name stays on the first page.
Verified
Verified on 2026-11-09. On 9 November 2026 the site, region, block and length counts, every index, interval and rate in Table 1, the raw-arm values, the pairing mean and percentiles, the pairing p values, every binding and non-binding rule with its value and bar, and the same-year correlation were re-read from the run's result file. The family q values, the forecasts against outcomes and the post hoc coefficients were re-read from the study's results report and its post hoc output file, and the forecasts again from the preregistration. They match the findings ledger. The SHA-256 of the result file matches the hash in the run's manifest and the abbreviated hash in the ledger, and the SHA-256 of the preregistration matches the hash recorded in the result file and its lock. Both figures were drawn by a script that reads only the result file.
Not checked. Three constants were re-derived for the study without its code (one summer mean from the CRU file, one Granger p value and one site distance) and matched; that check was not repeated for this paper. The F676 values in the discussion were read from the findings ledger; its result file was not opened for this paper. The study was not re-run. The literature was found by five searches run on 9 November 2026 and read at the level of abstracts, publisher pages and search summaries; the full texts were not read.
Terms on this page
Each term is defined where it is first used on this page. Each name below opens its entry in the findings glossary, which lists every page that uses it.
- known-answer test measurement and method validation first use
- panel statistics and econometrics first use
- Granger test econometrics and time-series statistics first use
- preregistration research method (metascience) first use
- kill condition research method (our usage, after Popper's falsification) first use
- binding check research method, our usage first use
- z-score of a p value statistics first use
- panel direction index time-series statistics, our usage first use
- block bootstrap statistics first use
- detection rate statistics, our usage first use
- high-pass filter signal processing first use
- first differences time-series statistics first use
- iAAFT surrogate time-series statistics, surrogate data first use
- direction accuracy method validation, our usage first use
- far-site pairing statistics, our usage first use
- Benjamini-Hochberg correction statistics, multiple testing first use
- control statistics and experimental design first use
- planted check research method; called a positive control in experimental science first use
- time reversal time-series analysis first use
- honest null research method (our usage) first use
- prior-summer coefficient dendroclimatology first use
- verdict research method (our usage) first use
To report an error, name the finding, the claim number and the source on the Work page, which gives the address. Accepted corrections join the Trail with their date.