
Findings F63 Plants, trees and earth, Biology and medicine found 2026-10-29
Across 1,175 tree-ring sites, an earlier moderate drought did not detectably toughen trees
We tested whether trees that lived through a moderate drought came through a later severe drought better. Across 1,175 North American tree-ring sites they did not, detectably, and a rerun with a finer drought grid gave the same null.
- Tier
- D, honest null
- Outcome
- honest null
- Rung
- killed
- Verdicts
- 19 passed, 17 failed
- Corrections
- 4, latest 2026-11-14
- Version
- v4, 2026-11-14
- Redo it
- Reproduce
Download PDF 492 KB BuildTeX source F63.bld
What this means for a reader
If someone tells you that forests exposed to drought become hardened against the next one, ask for the test against a version of the drought record moved in time. Across a large public archive of tree rings, trees that had lived through an earlier drought grew less in the severe drought year and bounced back more afterwards, and the two roughly cancelled. At this scale, drought "priming" of trees is not shown.
Objection
The 95% interval reaches +0.090 in log resilience, a gain of about 9 percent. Small conditioning effects are not ruled out.
What would change the call. Add a baseline for autocorrelation (biological memory) and state the test's power.
From the paper's first stated limitation; our register records no separate objection.
Abstract
A common intuition holds that stress hardens: a tree that came through a dry spell should cope better with the next one. We tested that idea on 1,175 tree-ring sites in the contiguous United States, 65 species and 3,780 site-drought events, with the test written down and hash-locked before the run. A moderate drought four to eleven years earlier moved log resilience to a later severe drought by +0.039 (95% interval -0.011 to +0.090), inside a time-shift null whose 95th percentile was 0.065 (p 0.18). The preregistered steeling test failed. A severe prior drought lowered growth in the drought year (resistance -0.087, p 0.006) and raised recovery after it by +0.096, so resilience barely moved. Part of that recovery gain follows from how the indices are built. A rerun with drought taken from 0.5 degree gridded data on 1,097 sites gave +0.025 (-0.009 to +0.059), below its own time-shift 95th percentile of 0.038 (p 0.14). The interval still allows a gain of up to about 9 percent in resilience, so small conditioning effects are not ruled out.
c1 observed, evidence for claim 1
- The numbers in claim 1
- +0.039; 95; -0.011; +0.090; 0.065; 0.18 matches the result file, 2026-11-09
- Chart 1
- How the steeling test was built: one model, a placebo window and two nulls.
- Chart 2
- Effect of an earlier drought on resilience and on its two parts, with 95% intervals.
- Chart 3
- The moderate-drought estimate against each null's range, main run and rerun.
- Chart 4
- Every rule set in advance for the tree-ring test, the value it tested and the bar.
- Basis
- observed: measured in this study, with a result file
c2 observed, evidence for claim 2
- The numbers in claim 2
- -0.087; 0.006; +0.096 matches the result file, 2026-11-09
- Chart 2
- Effect of an earlier drought on resilience and on its two parts, with 95% intervals.
- Basis
- observed: measured in this study, with a result file
c3 observed, evidence for claim 3
- The numbers in claim 3
- 0.5; 1,097; +0.025; -0.009; +0.059; 95; 0.038; 0.14 matches the result file, 2026-11-09
- Chart 3
- The moderate-drought estimate against each null's range, main run and rerun.
- Chart 4
- Every rule set in advance for the tree-ring test, the value it tested and the bar.
- Basis
- observed: measured in this study, with a result file
Introduction
The question comes from a broad idea about stress and adaptation: that a moderate earlier stress leaves an organism better prepared for a harder one. Applied to trees, we call this steelingDefinition: steeling psychology and stress biology, here applied to trees The idea that a moderate earlier stress leaves an organism better able to cope with a later, harder one. Here, that a tree which lived through a moderate drought loses less growth to a later severe drought. Excludes recovery from the same drought, and any gain that follows only from how the growth indices are computed. full definition. Trees make a good test, because each annual ring records growth, and public archives hold thousands of sites with records over a century long.
Forest ecology points mostly the other way. Anderegg and colleagues [1] examined stem growth after severe drought at 1,338 forest sites worldwide and reported a widespread drought legacyDefinition: drought legacy forest ecology Growth that stays below its expected level for one or more years after a drought ends. Excludes the loss of growth in the drought year itself. full definition: growth stayed low for one to four years after the drought, most often in dry ecosystems and in the pine family. Anderegg and colleagues [2] later asked whether forests acclimate to repeated droughts or become more vulnerable, and concluded that successive droughts are generally more damaging, with conifers the most affected. We read that paper at the level of its publisher page and press coverage.
The usual measures of drought response come from Lloret, Keeling and Sala [3], who proposed resistance, recovery and resilience indices from ring growth around a low-growth episode in ponderosa pine. Schwarz and colleagues [4] reviewed 82 studies that used these indices and listed cases where they mislead: a lagged growth minimum, depressed growth in the reference years before the drought, and repeated droughts. Their review bears on our result, because resilience equals resistance times recovery, so a weak drought-year ring raises recovery by arithmetic alone.
Our searches, run on 9 November 2026, found these and related studies on legacies and repeated drought. We did not find a study of this exact contrast, moderate earlier drought against later resilience, scored against a time-shifted drought record. That is a search result, not proof that none exists.
Preregistration and design
The design was written as a preregistrationDefinition: preregistration research method (metascience) A dated written plan for a study, fixed and hash-locked before any result is seen: the question, the data, the statistic, the controls, the forecasts and the kill conditions. Excludes a plan revised after looking at the outcome, and a protocol written only for the record after the run. full definition and hash-locked on 29 October 2026 at 22:54 UTC, before any hypothesis value was computed. A smoke run (a short trial run that checks the code executes) at small sizes before the lock printed design counts only: 1,175 sites, 3,780 events, 65 species, 177 climate divisions, and the prior-drought group sizes. No coefficient was printed or read.
The locked file covers four tests, A to D. Tests B to D are simulations of a loaded rod, a small neural network and a Bayesian learner, and they say nothing about trees. This paper reports Test A, the only test on real data. Across all four tests the run returned 22 verdictsDefinition: verdict research method (our usage) The pass or fail of one preregistered rule set against the run's numbers, read off by code. Excludes an interpretation written after reading the numbers. full definition, 10 passing and 12 failing.
Test A had four preregistered predictions, each a set of rules that must all hold:
- A1, steeling: the moderate-drought coefficient is above 0, its Benjamini-HochbergDefinition: Benjamini-Hochberg correction statistics, multiple testing A rule that adjusts a set of p values so that, among the tests called significant, the expected share of false calls stays at or below a chosen rate, here 0.05. The adjusted value is called q. Excludes the stricter Bonferroni rule, which bounds the chance of any false call. full definition adjusted q is below 0.05, and it is above the 95th percentile of both nulls.
- A2: the moderate-drought coefficient exceeds the severe-drought coefficient, with q below 0.05.
- A3: resilience rises and then falls with drought dose, by the two-lines testDefinition: two-lines test statistics (Simonsohn 2018) A test for a rise-then-fall shape that fits one straight line on each side of a data-chosen break point and asks whether the first rises and the second falls, both significantly. Excludes a quadratic fit, which can report a peak where none exists. full definition, with a statistic above 1.96 and above its shuffle 95th percentile.
- A placebo: grouping by a window after the event must not predict resilience (p at or above 0.05).
The forecast written before the run: A1 weak or null, A2 likely positive because severe drought leaves legacies, and A3 failing.
Data and provenance
Rings: standard chronologiesDefinition: standard chronology dendrochronology One yearly ring-width index for a site, made by removing each tree's age trend and averaging the trees, scaled so that an ordinary year is near 1. Excludes raw ring widths of single trees, and density or isotope records. full definition for the contiguous United States from the International Tree-Ring Data Bank [5], held by NOAA's National Centers for Environmental Information as public data with a request to cite the contributors. Ring width only. Years from 1896 with at least 5 samples where a sample count exists; index values at or below 0 dropped.
Drought, main test: NOAA nClimDiv divisional Palmer Drought Severity IndexDefinition: Palmer Drought Severity Index (PDSI) climatology and hydrology A monthly index of soil-moisture supply against demand built from temperature and precipitation. 0 is normal, -2 is moderate drought and -3 or lower is severe drought. Excludes a direct measurement of soil water, and drought indices built on precipitation alone. full definition, version 1.0.0 built on 6 October 2026 [6], US federal data with no restriction on use. Each site was placed in its climate divisionDefinition: climate division US climatology (NOAA) One of the regions into which NOAA splits the contiguous United States for climate records, each with one averaged monthly series per variable. Excludes a single weather station, and a regular grid cell. full definition by its coordinates, and the yearly drought value is the June to August mean of that division. The final sample is 1,175 sites, 65 species and 177 divisions, with 579 division drought years and 3,780 site-drought events.
Drought, rerun: the self-calibrating PDSIDefinition: self-calibrating PDSI (scPDSI) climatology A version of the Palmer index whose constants are fitted to each location's own climate, so that the thresholds mean similar rarity everywhere. Here taken from the CRU TS gridded product at 0.5 degree. Excludes the original Palmer index with fixed constants, and station measurements. full definition from CRU TS 4.10 at 0.5 degree, 1903 to 2025 [7] [8], released under the Open Database License 1.0 with attribution to the Climatic Research Unit, University of East Anglia. Each site takes the nearest cell with complete June to August data in at least 60 years, within 1 degree. This gave 1,097 sites, 64 species, 505 cells and 2,549 events.
A division averages over a large area, and a site sits at one point in it. The rerun exists to pay that debt. A 0.5 degree cell is closer to the site and is still not a station.
Methods
Events
A focal year is a division year with June to August PDSI at or below -3. An event needs ring growth in years to , no other severe year in to or to , and drought data for the exposure window to .
The Lloret indices
With the ring index in the drought year, the mean of the three years before and the mean of the three years after, the Lloret indicesDefinition: Lloret indices dendroecology Three ratios of ring growth around a drought year: resistance is the drought-year growth over the mean of the three years before, recovery is the mean of the three years after over the drought-year growth, and resilience is the mean after over the mean before. Excludes measures of tree death, and growth responses that unfold over more than three years. full definition are resistance, recovery and resilience:
All three are analysed as natural logarithms. The product in eq. 1 matters later: a lower drought-year ring lowers and raises by the same factor.
Exposure groups
The exposure is the lowest June to August PDSI in years to . An event is in the none group if that minimum is above -2, moderate if it lies above -3 and at or below -2, and severe if it is at or below -3. The groups held 986, 941 and 1,853 events. The dose is the larger of 0 and minus that minimum.
The model
For event at site in year :
where and mark the moderate and severe groups, , and are the drought-year PDSI and the mean PDSI of the three years before and after, and and are site and year fixed effectsDefinition: fixed effects econometrics and statistics One free constant per site (or species) and one per calendar year in a regression, so that differences between sites and between years cannot be mistaken for the effect of the variable under test. Excludes random effects, which treat those constants as draws from one distribution. full definition. Species are constant within a site, so site effects absorb them; a model with species and year effects was reported as secondary. Standard errors are clusteredDefinition: clustered standard errors econometrics Standard errors computed so that events in the same climate division may be correlated with each other, which widens the interval when they are. Excludes ordinary standard errors that treat every event as independent. full definition by climate division. Resistance and recovery were fitted with the same model as secondary outcomes. The coefficient under test is .
In the rerun, the preregistered primary model used species and year effects in place of site effects, with the same covariates and the same clustering by division.
Shape in dose
For prediction A3, resilience with site, year and covariate effects removed and no group terms was set against the dose, and the two-lines test was applied. Its statistic is the smaller of the rising line's z and minus the falling line's z, so a large positive value means a rise and then a fall.
Controls and planted checks
Test A had no planted checkDefinition: planted check research method; called a positive control in experimental science Data built so that the right answer is known, run through the same analysis before the real data, to show that the analysis can see the effect when it is there. Excludes any check made on the real data, which cannot show what the analysis misses. full definition: no synthetic forest with a known steeling effect was built and run through the model. The placebo window serves as the design check, together with three controlsDefinition: control statistics and experimental design A version of the data with the structure under test removed (for example shuffled or pooled), scored the same way as the real data, so the real score has something to beat. Excludes a comparison with a different dataset or with a published number. full definition.
- data1,175 sites, 3,780 eventsTree-ring sites in the contiguous United States, 65 species, 177 climate divisions. An event is a severe drought year with rings three years either side.
- measurementGroup each event by earlier droughtLowest summer drought index four to eleven years before: none (986), moderate (941), severe (1,853).
- measurementFit log resilienceResilience is growth after the drought over growth before it. The model has site and year effects; the tested term is the moderate group.
- controlPlacebo windowGroup by drought five to twelve years after the event. It gave +0.006 (p 0.86).
- controlTime-shift nullMove each division's drought record by 20 or more years and rebuild every event, 200 times. 95th percentile 0.065.
- controlLabel-permutation nullShuffle the prior-drought labels among each site's own events, 500 times. 95th percentile 0.020.
- rule set in advanceRule: above 0, adjusted q below 0.05, above both nullsWritten and hash-locked before the run.
- not shownSteeling by moderate droughtEstimate +0.039, adjusted q 0.166, time-shift p 0.18.
Read from main-result.json (main run, Test A is the tree-ring test), run 20261029T225453Z. SHA-256 of the run's file 0ef775ca981f2cdaca7b4df602b1c6514daba73ccb3035def7f36ef15d3c6828 and of the published copy 3f45948cc5e37aa74d4159f7fa6056759136bb601246732f7d3302b3e1ae01d6. In the copy, file paths are cut to the file name and the layout (indentation, line endings) may differ; every value is the same.
Read from rerun-result.json (rerun, MT2 is the gridded-drought rerun), run 20261030T033057Z. SHA-256 of the run's file fbfc39401773f4e60332c386f7672bf077eb41b0438317cfc61aa9dd028ce53f and of the published copy 455055ab3ace69835e4e4e1ebea51c9fc258acea7ea29b73d05f1a385e9b67f9. In the copy, file paths are cut to the file name and the layout (indentation, line endings) may differ; every value is the same.
- The time-shift nullDefinition: time-shift null time-series statistics, surrogate data A control in which each drought record is moved in time by a random offset of 20 years or more, with the end wrapped round to the start, and the events rebuilt. It keeps each record's own pattern of droughts and breaks its timing against the rings. Excludes shuffling single years, which also destroys the drought record's own pattern. full definition moves each division's PDSI record by a random offset of at least 20 years, wraps it, and rebuilds every event and group. It keeps each record's pattern of droughts and breaks its link with the rings. 200 draws. This is the null the preregistered rule binds.
- The label-permutation nullDefinition: label-permutation null statistics A control in which the prior-drought labels are shuffled among each site's own events, keeping every drought date in place. Excludes a null that moves the droughts themselves. full definition shuffles the prior-drought labels among each site's own events, 500 draws. It keeps every drought date in place, so it is the weaker comparison.
- The dose shuffle permutes residual resilience across dose for the two-lines test, 200 draws.
- The placebo windowDefinition: placebo window statistics and econometrics The same test run with the exposure window placed after the event, years 5 to 12 later, where no causal effect is possible, so that any effect found there points to a flaw in the design. Excludes a control on the outcome data. full definition groups each event by drought in years to , after the event.
Each p value from draws is the share of draws at or above the real value, with one added to the count and to the number of draws:
where is the number of draws at or above the real value and the number of draws. The real value is compared with the null distributionDefinition: null distribution statistics The spread of scores a control gives over many random draws. Its 95th percentile is the bar a real score must clear. Excludes a theoretical distribution assumed rather than drawn from the data. full definition's 95th percentile. The rerun used the same time-shift null on each grid cell's record, 200 draws.
Results
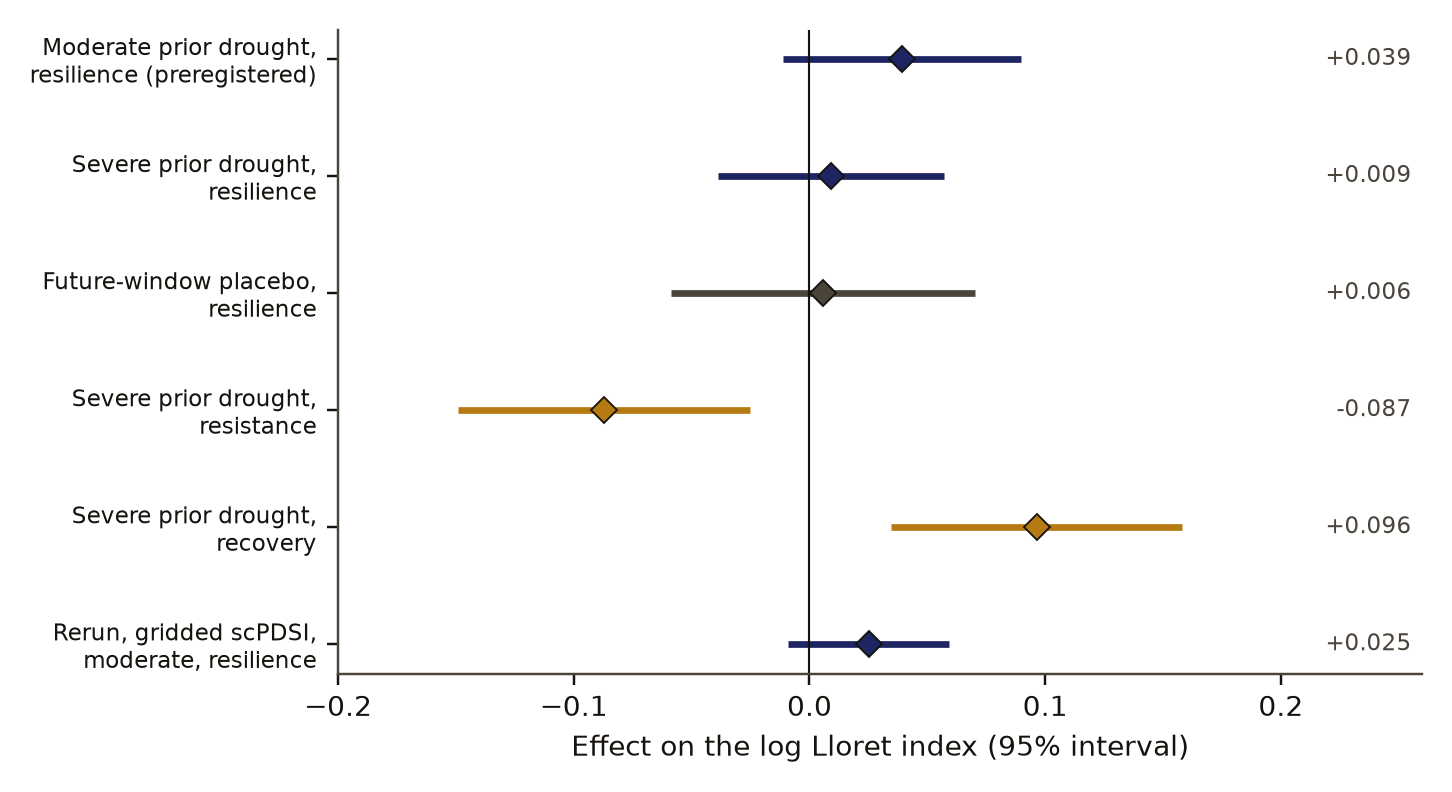
Table 1 gives the estimates, and Figure 1 draws the main ones. A moderate drought four to eleven years earlier moved log resilience to a later severe drought by +0.039 (95% interval -0.011 to +0.090), inside a time-shift null whose 95th percentile was 0.065 (p 0.18). Its raw p was 0.128 and its adjusted q 0.166. A severe prior drought gave +0.009 (-0.039 to +0.057). Moderate minus severe was +0.030 (-0.014 to +0.074, q 0.214).
change in log Lloret index against no prior drought (above 0 is a higher index)
- Resilience: growth after over growth before
- Resistance: drought-year growth over growth before
- Recovery: growth after over drought-year growth
- 95% interval, standard errors clustered by climate division
- no difference from events with no prior drought
Data behind chart 2 6 rows
| Estimate | Coefficient | 95% low | 95% high | p | Events |
|---|---|---|---|---|---|
| Resilience, main run (site and year effects): Moderate prior drought (the tested term) | +0.039 | −0.011 | +0.090 | 0.13 | 3,780 |
| Resilience, main run (site and year effects): Severe prior drought | +0.009 | −0.039 | +0.057 | 0.71 | 3,780 |
| Placebo window, main run: Drought after the event, moderate | +0.006 | −0.059 | +0.070 | 0.86 | 3,976 |
| Components after a severe prior drought, main run: Resistance: growth in the drought year | −0.087 | −0.149 | −0.025 | 0.006 | 3,780 |
| Components after a severe prior drought, main run: Recovery: growth after over drought year | +0.096 | +0.035 | +0.158 | 0.002 | 3,780 |
| Rerun on gridded drought (species and year effects): Moderate prior drought | +0.025 | −0.009 | +0.059 | 0.15 | 2,549 |
Read from main-result.json (main run, Test A is the tree-ring test), run 20261029T225453Z. SHA-256 of the run's file 0ef775ca981f2cdaca7b4df602b1c6514daba73ccb3035def7f36ef15d3c6828 and of the published copy 3f45948cc5e37aa74d4159f7fa6056759136bb601246732f7d3302b3e1ae01d6. In the copy, file paths are cut to the file name and the layout (indentation, line endings) may differ; every value is the same.
Read from rerun-result.json (rerun, MT2 is the gridded-drought rerun), run 20261030T033057Z. SHA-256 of the run's file fbfc39401773f4e60332c386f7672bf077eb41b0438317cfc61aa9dd028ce53f and of the published copy 455055ab3ace69835e4e4e1ebea51c9fc258acea7ea29b73d05f1a385e9b67f9. In the copy, file paths are cut to the file name and the layout (indentation, line endings) may differ; every value is the same.
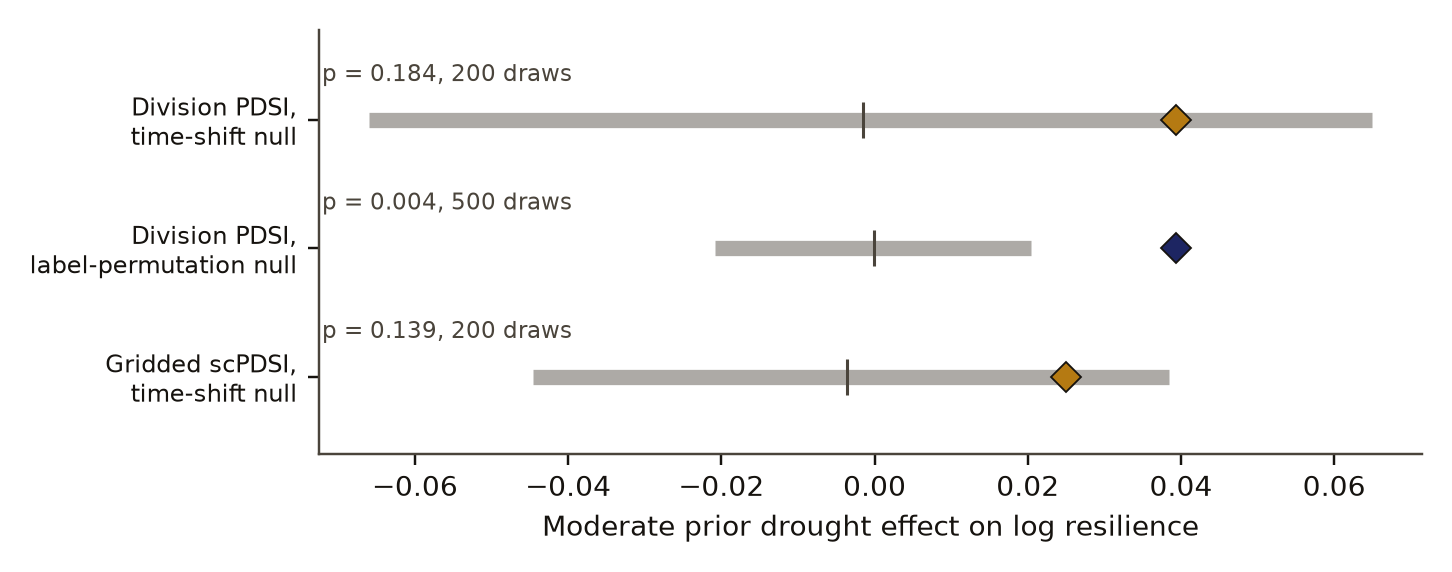
moderate prior drought coefficient on log resilience (higher is more resilience)
- real estimate
- null draws, 5th to 95th percentile
- control mean
Data behind chart 3 3 rows
| Run and null | Real estimate | Null mean | Null 5th pct | Null 95th pct | p | Draws |
|---|---|---|---|---|---|---|
| Main run, division drought index: Time-shift null (the binding one) | +0.039 | −0.001 | −0.066 | +0.065 | 0.18 | 200 |
| Main run, division drought index: Label-permutation null | +0.039 | −0.000 | −0.021 | +0.020 | 0.004 | 500 |
| Rerun, 0.5 degree gridded drought index: Time-shift null | +0.025 | −0.004 | −0.045 | +0.038 | 0.14 | 200 |
Read from main-result.json (main run, Test A is the tree-ring test), run 20261029T225453Z. SHA-256 of the run's file 0ef775ca981f2cdaca7b4df602b1c6514daba73ccb3035def7f36ef15d3c6828 and of the published copy 3f45948cc5e37aa74d4159f7fa6056759136bb601246732f7d3302b3e1ae01d6. In the copy, file paths are cut to the file name and the layout (indentation, line endings) may differ; every value is the same.
Read from rerun-result.json (rerun, MT2 is the gridded-drought rerun), run 20261030T033057Z. SHA-256 of the run's file fbfc39401773f4e60332c386f7672bf077eb41b0438317cfc61aa9dd028ce53f and of the published copy 455055ab3ace69835e4e4e1ebea51c9fc258acea7ea29b73d05f1a385e9b67f9. In the copy, file paths are cut to the file name and the layout (indentation, line endings) may differ; every value is the same.
| Rule set in advance | Value | Bar | Result |
|---|---|---|---|
| A1: moderate-drought coefficient above 0 | +0.039 | 0 | held |
| A1: adjusted q below 0.05 | 0.166 | 0.05 | failed |
| A1: coefficient above the time-shift 95th percentile | +0.039 | 0.065 | failed |
| A1: coefficient above the label-permutation 95th percentile | +0.039 | 0.020 | held |
| A2: moderate minus severe above 0 | +0.030 | 0 | held |
| A2: adjusted q below 0.05 | 0.214 | 0.05 | failed |
| A3: rise-then-fall statistic above 1.96 | −0.895 | 1.96 | failed |
| A3: statistic above its dose-shuffle 95th percentile | −0.895 | 1.256 | failed |
| Placebo window: p at or above 0.05 | 0.862 | 0.05 | held |
| Rerun: coefficient above its time-shift 95th percentile | +0.025 | 0.038 | failed |
Data behind chart 4 10 rows
| Rule set in advance | Value | Bar | Result |
|---|---|---|---|
| A1: moderate-drought coefficient above 0 | +0.039 | 0 | held |
| A1: adjusted q below 0.05 | 0.166 | 0.05 | failed |
| A1: coefficient above the time-shift 95th percentile | +0.039 | 0.065 | failed |
| A1: coefficient above the label-permutation 95th percentile | +0.039 | 0.020 | held |
| A2: moderate minus severe above 0 | +0.030 | 0 | held |
| A2: adjusted q below 0.05 | 0.214 | 0.05 | failed |
| A3: rise-then-fall statistic above 1.96 | −0.895 | 1.96 | failed |
| A3: statistic above its dose-shuffle 95th percentile | −0.895 | 1.256 | failed |
| Placebo window: p at or above 0.05 | 0.862 | 0.05 | held |
| Rerun: coefficient above its time-shift 95th percentile | +0.025 | 0.038 | failed |
Read from main-result.json (main run, Test A is the tree-ring test), run 20261029T225453Z. SHA-256 of the run's file 0ef775ca981f2cdaca7b4df602b1c6514daba73ccb3035def7f36ef15d3c6828 and of the published copy 3f45948cc5e37aa74d4159f7fa6056759136bb601246732f7d3302b3e1ae01d6. In the copy, file paths are cut to the file name and the layout (indentation, line endings) may differ; every value is the same.
Read from rerun-result.json (rerun, MT2 is the gridded-drought rerun), run 20261030T033057Z. SHA-256 of the run's file fbfc39401773f4e60332c386f7672bf077eb41b0438317cfc61aa9dd028ce53f and of the published copy 455055ab3ace69835e4e4e1ebea51c9fc258acea7ea29b73d05f1a385e9b67f9. In the copy, file paths are cut to the file name and the layout (indentation, line endings) may differ; every value is the same.
Figure 2 sets the moderate-drought estimate against the three null ranges. It sits inside the time-shift range in both runs and above the label-permutation range (95th percentile 0.020, p 0.004). The label permutation keeps each site's drought timing, so beating it says less, and the preregistered rule used the time shift.
The components explain the null in resilience. A severe prior drought lowered growth in the drought year (resistance -0.087, p 0.006) and raised recovery after it by +0.096, so resilience barely moved. By eq. 1, a lower drought-year ring raises recovery by the same factor it lowers resistance, so the recovery gain is partly arithmetic and is not evidence of conditioning.
The placebo window was clean: drought after the event gave +0.006 (p 0.86). No rise-then-fall shape appeared with dose. The two lines fell and then rose, neither significantly (z -0.89 and +0.81), and the statistic of -0.89 sat below its shuffle 95th percentile of 1.26. The mean residual resilience by number of moderate-drought years in the window was -0.007 for none (1,705 events), +0.005 for one (1,268), +0.008 for two (643), -0.019 for three (103) and +0.059 for four (44). These five groups hold 3,763 of the 3,780 events; the result file lists no group for the other 17.
c4 observed, evidence for claim 4
- The numbers in claim 4
- +0.006; 0.86 matches the result file, 2026-11-09
- Chart 1
- How the steeling test was built: one model, a placebo window and two nulls.
- Chart 2
- Effect of an earlier drought on resilience and on its two parts, with 95% intervals.
- Chart 4
- Every rule set in advance for the tree-ring test, the value it tested and the bar.
- Basis
- observed: measured in this study, with a result file
With species and year effects in place of site effects, the moderate prior drought gave +0.037 (0.000 to +0.074, p 0.047), and severe +0.035 (p 0.089). The two did not differ (+0.002), so under that model any prior drought went with slightly higher resilience, with no edge for a moderate one. The rerun tested that sign.
The rerun on gridded drought
The rerun, preregistered and locked on 30 October 2026 at 03:20 UTC, took drought from the nearest 0.5 degree cell of the CRU self-calibrating PDSI. Its kill conditionDefinition: kill condition research method (our usage, after Popper's falsification) A rule written in the preregistration that, when met, decides against the claim with no room for judgement after the run. Excludes reasons found after the run for setting a result aside. full definition fires when the 95% interval of the species-effects estimate includes 0 or the estimate sits at or below the time-shift 95th percentile. Table 2 gives its estimates.
A rerun with drought taken from 0.5 degree gridded data on 1,097 sites gave +0.025 (-0.009 to +0.059), below its own time-shift 95th percentile of 0.038 (p 0.14). The kill condition fired on both of its rules, and the adjusted q was 0.174. The small positive sign under division drought with species effects did not survive the finer drought data. Resistance fell and recovery rose, as in the main run.
Table 3 sets the forecasts written before the main run against the outcomes.
Discussion
The test asked whether moderate drought conditions trees for a later severe one. It found no effect beyond what a drought record moved in time also produces, in two runs with two drought products. That is an honest nullDefinition: honest null research method (our usage) A working test that found no effect beyond a stated bound, a forecast that failed, or an error of our own found and fixed, reported with the same weight as a positive result. Excludes a void run, and a result left unpublished because it was negative. full definition: a working test, a clean placebo, and an estimate inside its null.
The result fits the direction of Anderegg and colleagues [2], who reported that repeated droughts tend to hurt more. Our severe-prior estimates of resistance fit the legacy picture of Anderegg and colleagues [1]: a tree that has been through a severe drought lays down a narrower ring in the next one.
The recovery gain is where a careless reading would find steeling. Recovery rose by about as much as resistance fell. Schwarz and colleagues [4] warned that Lloret's indices mislead when growth in the reference years is depressed or droughts repeat, and eq. 1 shows the simplest version of the problem. A study that reported recovery alone would see trees "bouncing back" better after earlier drought. The resilience ratio, which cancels the drought-year ring, shows no net gain.
The label-permutation null is the trap on the other side. The estimate beat it with p 0.004. That null keeps every drought date in place, so it compares events within a site's own history and does not remove effects tied to when droughts fell. We fixed the time-shift null as binding before the run, and it was not beaten.
Limitations
- The 95% interval reaches +0.090 in log resilience, a gain of about 9 percent. Small conditioning effects are not ruled out.
- No planted forest with a known steeling effect was run through the model, so the design's ability to detect an effect is shown only by the width of its interval.
- No autocorrelation baseline for growth memory was fitted, so part of any legacy could be the persistence of the ring series itself.
- The recovery gain is partly mechanical, by eq. 1.
- Division drought is coarse. The rerun's 0.5 degree cells are closer to the sites and are still gridded estimates, not station data.
- In the rerun with site effects in place of species effects, a severe prior drought gave +0.064 (+0.009 to +0.118, uncorrected p 0.022). That model was not the preregistered test there. We read it as a lead for a new locked study.
- Sites are in the contiguous United States and the record is ring width only.
- Scoring was done by our own code and was not blind.
Evidence
Honest null. The 95 percent interval runs to +0.090 in log resilience, about a 9 percent gain, so small conditioning effects stay open.
Figures
These are the paper's own figures, numbered as in the PDF, and each "Figure" reference in the text points here. The charts on this page redraw the same results from the result files and carry their own numbers.
Tables
| Outcome and term | Estimate | 95% interval | p | Events |
|---|---|---|---|---|
| Resilience, moderate prior | +0.039 | -0.011 to +0.090 | 0.128 | 3,780 |
| Resilience, severe prior | +0.009 | -0.039 to +0.057 | 0.71 | 3,780 |
| Resilience, moderate minus severe | +0.030 | -0.014 to +0.074 | 0.18 | 3,780 |
| Placebo window, moderate | +0.006 | -0.059 to +0.070 | 0.86 | 3,976 |
| Species effects, moderate | +0.037 | 0.000 to +0.074 | 0.047 | 3,780 |
| Species effects, severe | +0.035 | -0.005 to +0.076 | 0.089 | 3,780 |
| Resistance, moderate prior | -0.063 | -0.155 to +0.028 | 0.18 | 3,780 |
| Resistance, severe prior | -0.087 | -0.149 to -0.025 | 0.006 | 3,780 |
| Recovery, moderate prior | +0.103 | +0.025 to +0.180 | 0.010 | 3,780 |
| Recovery, severe prior | +0.096 | +0.035 to +0.158 | 0.002 | 3,780 |
| Outcome and term | Estimate | 95% interval | p | Events |
|---|---|---|---|---|
| Resilience, moderate prior | +0.025 | -0.009 to +0.059 | 0.15 | 2,549 |
| Resilience, severe prior | +0.018 | -0.022 to +0.058 | 0.37 | 2,549 |
| Site effects, moderate prior | +0.049 | -0.002 to +0.101 | 0.062 | 2,549 |
| Site effects, severe prior | +0.064 | +0.009 to +0.118 | 0.022 | 2,549 |
| Resistance, moderate prior | -0.046 | -0.110 to +0.017 | 0.15 | 2,549 |
| Recovery, moderate prior | +0.072 | +0.009 to +0.134 | 0.024 | 2,549 |
| Placebo window, moderate | -0.010 | -0.041 to +0.022 | 0.55 | 2,803 |
| Prediction | Forecast | Outcome |
|---|---|---|
| A1 steeling | weak or null | fail, null |
| A2 moderate beats severe | likely positive | fail, +0.030 with q 0.214 |
| A3 rise then fall in dose | fail | fail |
| Placebo window | clean | clean |
Appendix A. The preregistered verdicts
Each verdict is a set of rules written before the run. A verdict passes only when every rule holds. Values are read from the result files.
| Verdict | Deciding rule | Value | Holds |
|---|---|---|---|
| A1 steeling | moderate estimate above 0; q below 0.05; above time-shift 95th percentile (0.065); above permutation 95th percentile (0.020) | 0.039; 0.166; 0.039; 0.039 | no |
| A2 moderate beats severe | difference above 0; q below 0.05 | 0.030; 0.214 | no |
| A3 rise then fall | two-lines statistic above 1.96 and above its shuffle 95th percentile (1.26) | -0.89 | no |
| Placebo clean | placebo p at or above 0.05 | 0.86 | yes |
| Rerun, steeling holds | kill condition not met: interval excludes 0 and estimate above time-shift 95th percentile (0.038) | -0.009 to +0.059; 0.025 | no |
Numbers recorded in our publication register
| What | Value |
|---|---|
| Sample | 1,175 sites, 65 species, 3,780 site-drought events, 579 division droughts |
| Main estimate and interval | +0.039 (-0.011 to +0.090), adjusted q 0.17; rerun +0.025 (-0.009 to +0.059) |
| Forecast against outcome | the steeling test failed (A1 FAIL), as the forecast of a weak or null effect expected |
| Known-answer check | none for test A; in the toy test D the Bayesian case matches its closed form by construction |
As recorded in the publication register, the summary row each finding gets; the paper's own numbers above were re-read from the result files.
What lowers it
- blinding Not blind. Resilience is resistance times recovery, which makes the recovery gain partly mechanical. from our publication register, on blinding
- failed check Controls: the placebo window for test A was clean; the estimate did not beat the 95th percentile of the time-shifted drought record (0.065); the control for the toy test B failed through a fault in its metric. from our publication register, on controls
- missing control No positive control. from our publication register, on the known-answer check
- imprecision The 95 percent interval runs to +0.090 in log resilience, about a 9 percent gain, so small conditioning effects stay open. from the bound stated under Evidence
- novelty Nearby work exists; novelty is not shown. from our publication register, on the literature
- depth of reading The cited literature was read at the level of abstracts, publisher pages, press coverage and search summaries; full texts were not read. from the Verified section
What holds it up
- scoring Scored by code against rules fixed in advance. from our publication register, on who scored it
- preregistration Preregistered and hash-locked before the run (sha256 1e723097). from the Reproduce section
- replication Rechecked by F95 (test A, moderate prior drought): A repeat of test A on gridded scPDSI near each site gave +0.025, below the time-shift 95th percentile of 0.038; the kill fires again. from a later finding
- open data Public data. from our publication register, on the data licence
Where the claim stands
- lead
- hypothesis
- thesis
- conjecture
- theorem
- law candidate
- killed
Drought steeling: the steeling test failed across 1,175 sites. Tier D: Test A is a null on real data with a clean placebo, and it stayed null in a rerun with drought measured near each site. The interval still allows gains up to about 9 percent. Tests B to D are toy-model results, and the control for test B failed.
Trail
Versions
- v4 2026-11-14, this page corrected, 2 items; the PDF and its BuildTeX source are still paper version 1.0
- v3 2026-11-09, paper version 1.0, first published PDF sha256 0d2acf8b4815746b
- v2 2026-10-30, dated correction, 1 item
- v1 2026-10-29, entered in the findings ledger
Corrections
2026-11-14 wording found by a review of the published pages
A review of the published page found the title stated as a flat negative. now The interval still allows a gain of up to about 9 percent, so the title now says the earlier drought did not detectably toughen trees, as the summary already did.
2026-11-14 wording found by a review of the published pages
A review of the published page found a count that does not add up. now The five groups by number of moderate-drought years hold 3,763 events and the sample is 3,780; the result file lists no group for the other 17, and the text now says so. One chart listed the time-shift comparison under what is ruled out; a p of 0.18 shows no effect and rules none out, and the chart now says that.
2026-11-09 number found by the publication pass
The findings ledger headline and the run's own summary gave 9 passing and 13 failing verdicts across Tests A to D. The result file and the ledger entry's own list of names give 10 passing and 12 failing. now No tree value changes.
2026-10-30 wording found by the study itself, before publication
The gridded rerun found that the positive sign under division drought with species effects (+0.037, p 0.047) did not survive site-scale drought (+0.025, below the time-shift 95th percentile of 0.038). now Forest and stress models keep no steeling as the default. This paper reports both.
Standing, and the ledger entries it rests on
2026-10-30 held F95
Set by hand from findings ledger entry F95, dated 2026-10-30: test A, moderate prior drought. Rests on findings ledger, F95 MT2.
2026-10-30 narrowed in part F95
Set by hand from findings ledger entry F95, dated 2026-10-30: within-species steeling sign. Rests on findings ledger, prior updates of 2026-10-30; findings ledger, Prior updates 2026-10-30.
2026-10-29 extended F87
Set by hand from findings ledger entry F87, dated 2026-10-29: rod tests B3 and B4. Rests on findings ledger, F87.
2026-10-29 extended F75
Set by hand from findings ledger entry F75, dated 2026-10-29: test D update weight. Rests on findings ledger, F75.
Each correction is a dated note; the findings ledger is never rewritten, and a note governs where it differs.
Ledger and version dates up to publication are local dates in US Pacific time. Clock times in the text are UTC, seven or eight hours ahead, so a lock or a run stamped just after midnight UTC belongs to the previous local day. Corrections from 14 November 2026 on are dated in UTC.
References
- Anderegg, W. R. L., Schwalm, C., Biondi, F., Camarero, J. J., Koch, G., Litvak, M., Ogle, K., Shaw, J. D., Shevliakova, E., Williams, A. P., Wolf, A., Ziaco, E. and Pacala, S. (2015). Pervasive drought legacies in forest ecosystems and their implications for carbon cycle models. Science 349, 528-532. doi:10.1126/science.aab1833 abstract or summary, 2026-11-09: abstracts, publisher pages, press coverage and search summaries; full text not read used in Introduction, Discussion
- Anderegg, W. R. L., Trugman, A. T., Badgley, G., Konings, A. and Shaw, J. (2020). Divergent forest sensitivity to repeated extreme droughts. Nature Climate Change 10, 1091-1095. doi:10.1038/s41558-020-00919-1 abstract or summary, 2026-11-09: abstracts, publisher pages, press coverage and search summaries; full text not read used in Introduction, Discussion
- Lloret, F., Keeling, E. G. and Sala, A. (2011). Components of tree resilience: effects of successive low-growth episodes in old ponderosa pine forests. Oikos 120, 1909-1920. doi:10.1111/j.1600-0706.2011.19372.x abstract or summary, 2026-11-09: abstracts, publisher pages, press coverage and search summaries; full text not read used in Introduction
- Schwarz, J., Skiadaresis, G., Kohler, M., Kunz, J., Schnabel, F., Vitali, V. and Bauhus, J. (2020). Quantifying growth responses of trees to drought: a critique of commonly used resilience indices and recommendations for future studies. Current Forestry Reports 6, 185-200. doi:10.1007/s40725-020-00119-2 abstract or summary, 2026-11-09: abstracts, publisher pages, press coverage and search summaries; full text not read used in Introduction, Discussion
- International Tree-Ring Data Bank. NOAA National Centers for Environmental Information, World Data Service for Paleoclimatology. Standard chronologies, North America. https://www.ncei.noaa.gov/pub/data/paleo/treering/ run here Licence: ITRDB, a public archive at NOAA, with contributors cited (its page states no licence text); NOAA nClimDiv is public; CRU scPDSI under the Open Database License for the rerun used in Data and provenance
- NOAA National Centers for Environmental Information. nClimDiv climate division data, Palmer Drought Severity Index, version 1.0.0, build of 6 October 2026, with the contiguous US climate division boundaries. Retrieved 29 October 2026. run here Licence: ITRDB, a public archive at NOAA, with contributors cited (its page states no licence text); NOAA nClimDiv is public; CRU scPDSI under the Open Database License for the rerun used in Data and provenance
- Harris, I., Osborn, T. J., Jones, P. and Lister, D. (2020). Version 4 of the CRU TS monthly high-resolution gridded multivariate climate dataset. Scientific Data 7, 109. doi:10.1038/s41597-020-0453-3 run here Licence: ITRDB, a public archive at NOAA, with contributors cited (its page states no licence text); NOAA nClimDiv is public; CRU scPDSI under the Open Database License for the rerun used in Data and provenance
- Climatic Research Unit, University of East Anglia. CRU TS 4.10 self-calibrating Palmer Drought Severity Index, 0.5 degree, 1903 to 2025. Open Database License 1.0. https://crudata.uea.ac.uk/cru/data/hrg/ run here Licence: ITRDB, a public archive at NOAA, with contributors cited (its page states no licence text); NOAA nClimDiv is public; CRU scPDSI under the Open Database License for the rerun used in Data and provenance
Cited by later findings
- F95 held, test A, moderate prior drought, 2026-10-30 (record findings ledger, F95 MT2). A repeat of test A on gridded scPDSI near each site gave +0.025, below the time-shift 95th percentile of 0.038; the kill fires again.
- F95 narrowed in part, within-species steeling sign, 2026-10-30 (record findings ledger, prior updates of 2026-10-30; findings ledger, Prior updates 2026-10-30). The +0.037 sign under division PDSI with species effects does not survive site-scale drought.
- F87 extended, rod tests B3 and B4, 2026-10-29 (record findings ledger, F87). Adds the cost term the rod lacked; removing it reproduces F63 B3 and B4.
- F75 extended, test D update weight, 2026-10-29 (record findings ledger, F75). Constant-rate copying follows F63's 1/(n+1) form at r 0.993.
Reproduce
Data
- International Tree-Ring Data Bank. Licence: ITRDB, a public archive at NOAA, with contributors cited (its page states no licence text); NOAA nClimDiv is public; CRU scPDSI under the Open Database License for the rerun. https://www.ncei.noaa.gov/pub/data/paleo/treering/
- nclimdiv. Licence: ITRDB, a public archive at NOAA, with contributors cited (its page states no licence text); NOAA nClimDiv is public; CRU scPDSI under the Open Database License for the rerun.
- Harris 2020. Licence: ITRDB, a public archive at NOAA, with contributors cited (its page states no licence text); NOAA nClimDiv is public; CRU scPDSI under the Open Database License for the rerun. https://doi.org/10.1038/s41597-020-0453-3
- cruts. Licence: ITRDB, a public archive at NOAA, with contributors cited (its page states no licence text); NOAA nClimDiv is public; CRU scPDSI under the Open Database License for the rerun. https://crudata.uea.ac.uk/cru/data/hrg/
Preregistration
sha256 1e7230973641a2c07fe5eb1b44bc6874eff80c7b85ff081920c22d21ee93ca7c
plan 99b4edfab5def0ab554b7188acd68254cc4d5fc80d9bcd5b07625c1c9ff583ce
Steps
- Data: ITRDB standard ring-width chronologies for the contiguous United States; NOAA nClimDiv divisional PDSI; for the rerun, CRU TS 4.10 scPDSI at 0.5 degree.
- Place each site in its climate division and take the June to August mean PDSI. Mark severe drought years at -3 or below and build events and exposure groups as in the methods.
- Compute eq. 1 as logarithms and fit eq. 2 with site and year effects and division-clustered errors.
- Repeat with each division's PDSI record shifted by a random offset of 20 years or more, 200 times, and compute eq. 3. Run the label permutation 500 times and the placebo window once.
- Rerun with the nearest scPDSI cell for each site, species and year effects, and 200 shifts of each cell's record.
- Main run: preregistration SHA-256 1e7230973641a2c07fe5eb1b44bc6874eff80c7b85ff081920c22d21ee93ca7c. Plan SHA-256 99b4edfab5def0ab554b7188acd68254cc4d5fc80d9bcd5b07625c1c9ff583ce. Run 20261029T225453Z. Result file SHA-256 0ef775ca981f2cdaca7b4df602b1c6514daba73ccb3035def7f36ef15d3c6828.
- Rerun: preregistration SHA-256 aabf64d9ea802d33515d9cf768a30fabaf9e9d61587b0431b72fd495147938c8. Plan SHA-256 ec3e804546d9bc3654c41c19e1b781d5b95aded086f8f1bbf2aed72f49688d6c. Run 20261030T033057Z. Result file SHA-256 fbfc39401773f4e60332c386f7672bf077eb41b0438317cfc61aa9dd028ce53f.
Cost. The main run took about ten minutes on one desktop CPU for all four tests, 132.4 kJ measured at the machine; Test A's model took 2.3 seconds and its time-shift null 132 seconds. The rerun's tree test took 18 seconds. The study was not re-run for this paper.
Downloads
- Whitepaper, PDF F63.pdf, 492 KB
- BuildTeX source F63.bld, 36 KB
- Build receipt F63.buildtex.json, 1 KB
- BuildLang doc module doc.bld, 5 KB, imported by the source
The PDF is typeset by BuildTeX from F63.bld, which is written from the same source as this page. The receipt records the source's SHA-256 and the PDF's (0d2acf8b4815), so anyone can rebuild it and compare. The copy here has its hidden author field blanked, as the site does for every file it publishes; blank the same field in a rebuild before comparing. The name stays on the first page.
Verified
Verified on 2026-11-09. On 9 November 2026 the counts (1,175 sites, 65 species, 177 divisions, 579 division droughts, 3,780 events and the three group sizes), every estimate, interval and p value in Table 1, the adjusted q values, the time-shift and label-permutation null percentiles and p values, the two-lines statistics and the residuals by number of moderate years were re-read from the main run's result file. The rerun's counts and every value in Table 2, its null percentile, p and q, and its kill verdict were re-read from its own result file. All tree values match the findings ledger. The SHA-256 of each preregistration matches the hash recorded in its result file. Both figures were drawn by a script that reads only the two result files. The verdict count across all four tests, 10 passing and 12 failing, was counted from the main result file and differs from the ledger headline; see Corrections.
Not checked. The study was not re-run for this paper. The literature was found by searches run on 9 November 2026 and read at the level of abstracts, publisher pages, press coverage and search summaries; the full texts were not read.
Terms on this page
Each term is defined where it is first used on this page. Each name below opens its entry in the findings glossary, which lists every page that uses it.
- steeling psychology and stress biology, here applied to trees first use
- drought legacy forest ecology first use
- preregistration research method (metascience) first use
- verdict research method (our usage) first use
- Benjamini-Hochberg correction statistics, multiple testing first use
- two-lines test statistics (Simonsohn 2018) first use
- standard chronology dendrochronology first use
- Palmer Drought Severity Index (PDSI) climatology and hydrology first use
- climate division US climatology (NOAA) first use
- self-calibrating PDSI (scPDSI) climatology first use
- Lloret indices dendroecology first use
- fixed effects econometrics and statistics first use
- clustered standard errors econometrics first use
- planted check research method; called a positive control in experimental science first use
- control statistics and experimental design first use
- time-shift null time-series statistics, surrogate data first use
- label-permutation null statistics first use
- placebo window statistics and econometrics first use
- null distribution statistics first use
- kill condition research method (our usage, after Popper's falsification) first use
- honest null research method (our usage) first use
To report an error, name the finding, the claim number and the source on the Work page, which gives the address. Accepted corrections join the Trail with their date.