
Findings F50 Biology and medicine, Psychology and perception found 2026-10-29
Childhood trauma scores showed no meaningful link to amygdala-prefrontal coupling in 187 adults
In a preregistered test on open brain-scan data, adults' childhood trauma questionnaire scores were unrelated to resting connectivity between the amygdala and the ventromedial prefrontal cortex (partial r -0.006). The result rules out effects of 0.20 or larger and leaves smaller ones between 0.10 and 0.20 open.
- Tier
- D, honest null
- Outcome
- honest null
- Rung
- hypothesis
- Corrections
- 3, latest 2026-11-14
- Version
- v3, 2026-11-14
- Redo it
- Reproduce
Download PDF 578 KB BuildTeX source F50.bld
What this means for a reader
Small studies have reported that people who were maltreated as children show weaker resting coupling between the amygdala and the prefrontal cortex. In 187 adults, with the test fixed in advance, we found no association of a size that would matter, and a much larger study found the same in 1,325 adults. Treat a strong resting-state version of the claim with caution. A weak effect is still possible, two trauma subscales gave inconclusive results, and other kinds of brain measurement were not tested.
Objection
An anatomical mask, a low-pass rule for head motion (framewise displacement) used outside the single-band data it was validated on, retrospective self-report, and no positive control showing the pipeline finds a known effect.
What would change the call. Add a second open sample or functional vmPFC mask to shrink the 0.10 to 0.20 gap; add a positive control.
From the strongest objection recorded in our publication register.
Abstract
A widely discussed idea holds that childhood maltreatment weakens the coupling between the amygdala, which responds to threat, and the ventromedial prefrontal cortex, which helps regulate that response. We tested one resting-state form of the idea with the analysis fixed before any questionnaire value or image was seen. The data are the Transdiagnostic Connectome Project on OpenNeuro (CC0): 241 adults with and without psychiatric diagnoses, preprocessed in full, of whom 187 met the motion and questionnaire rules. Childhood trauma scores were unrelated to amygdala-vmPFC resting connectivity in 187 adults: partial r -0.006, 95% interval -0.152 to 0.140. The 90% interval, -0.129 to 0.117, lies inside -0.20 to 0.20, so effects of 0.20 or larger in size are excluded at the preregistered bound. A secondary region gave r -0.025. Shuffling the trauma scores 10,000 times placed the observed value at the 47th percentile. Fifteen exploratory sensitivity analyses moved the primary r between -0.081 and 0.081, and none reached an association. The emotional-neglect and physical-abuse subscale analyses, r 0.081 and -0.081, are inconclusive because their 90% intervals touch 0.20. Power to detect a correlation of 0.20 was 0.77, so true effects between 0.10 and 0.20 remain open.
c1 observed, evidence for claim 1
- The numbers in claim 1
- 187; -0.006; 95; -0.152; 0.140 matches the result file, 2026-11-09
- Chart 1
- From 241 scanned adults to one equivalence decision.
- Chart 2
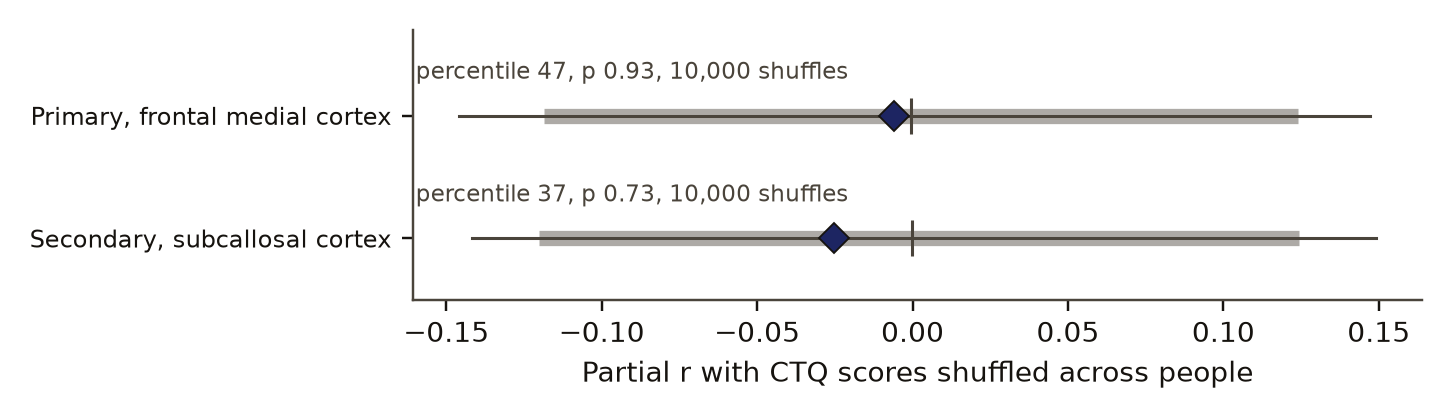
- Observed partial r against 10,000 shuffles of the trauma scores.
- Chart 3
- The two registered tests against the preregistered bound of 0.20.
- Basis
- observed: measured in this study, with a result file
c2 observed, evidence for claim 2
- The numbers in claim 2
- 90; -0.129; 0.117; -0.20; 0.20 matches the result file, 2026-11-09
- Chart 1
- From 241 scanned adults to one equivalence decision.
- Chart 3
- The two registered tests against the preregistered bound of 0.20.
- Basis
- observed: measured in this study, with a result file
c3 observed, evidence for claim 3
- The numbers in claim 3
- -0.081; 0.081 matches the result file, 2026-11-09
- Chart 4
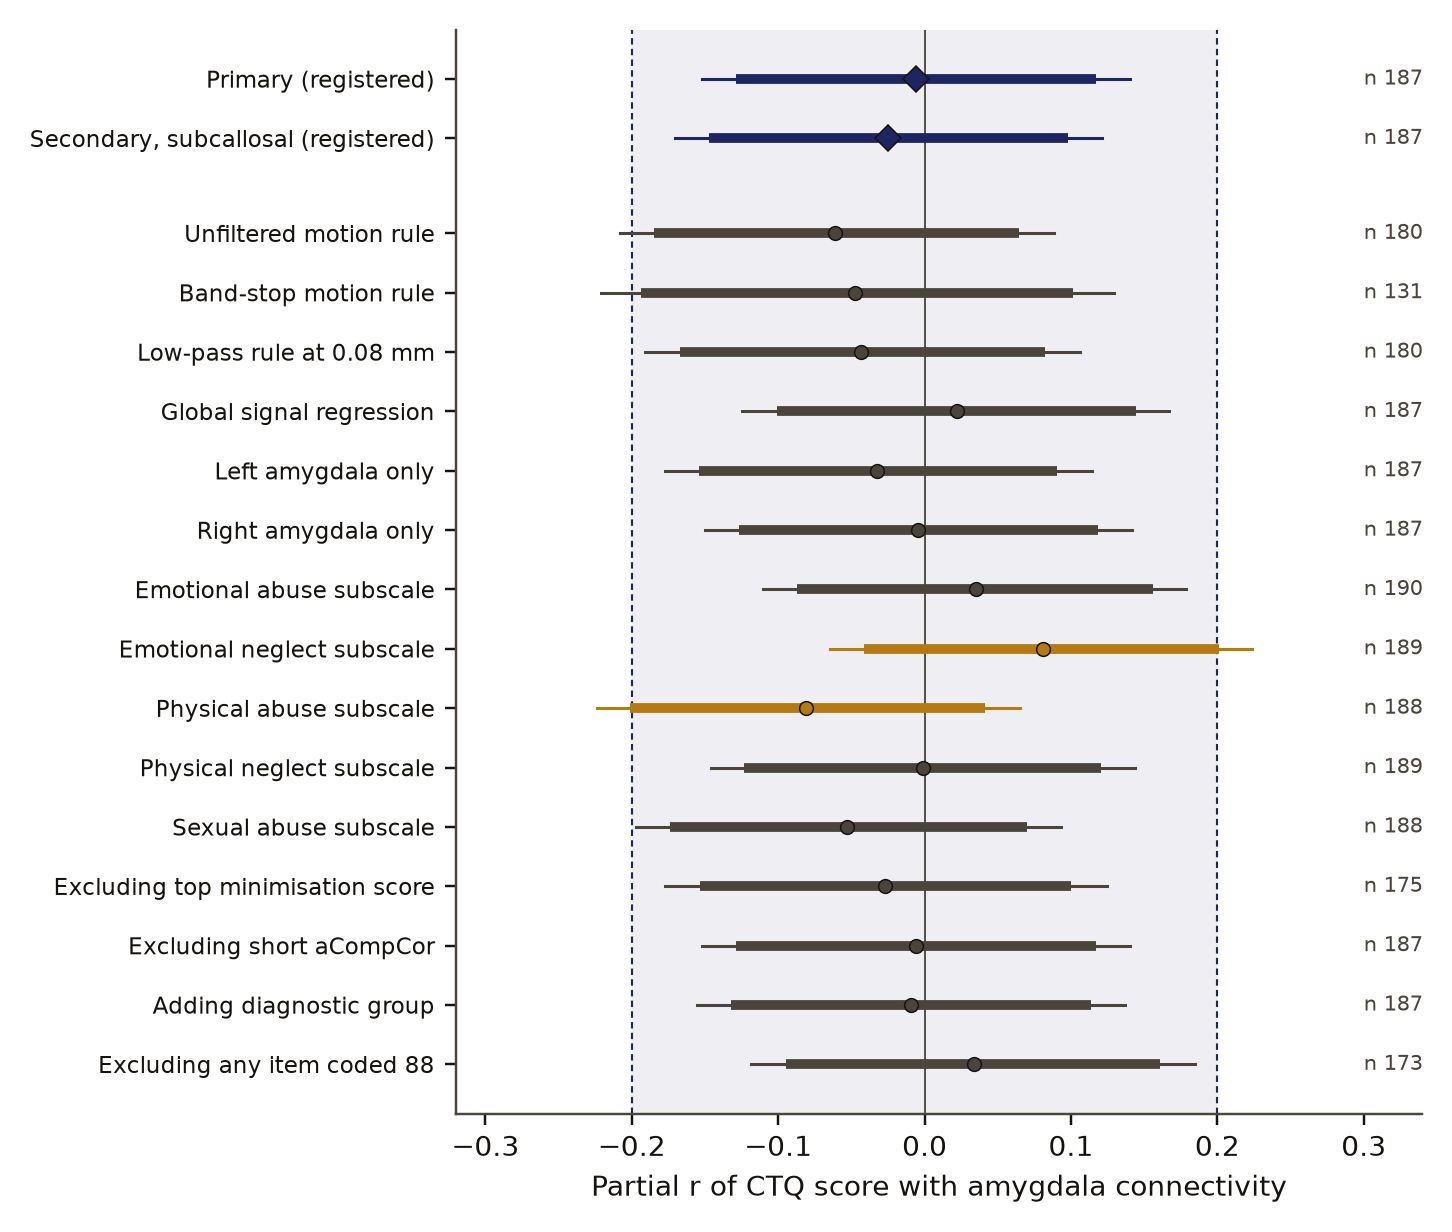
- Fifteen exploratory re-analyses of the primary test, each against the bound.
- Basis
- observed: measured in this study, with a result file
c4 observed, evidence for claim 4
- The numbers in claim 4
- 0.081; -0.081; 90; 0.20 matches the result file, 2026-11-09
- Chart 4
- Fifteen exploratory re-analyses of the primary test, each against the bound.
- Basis
- observed: measured in this study, with a result file
c5 observed, evidence for claim 5
- The numbers in claim 5
- 0.20; 0.77; 0.10 matches the result file, 2026-11-09
- Basis
- observed: measured in this study, with a result file
Introduction
The amygdalaDefinition: amygdala neuroanatomy A pair of almond-shaped structures deep in the temporal lobes, one per hemisphere, involved in detecting threat and in emotional learning. Excludes its separate subnuclei, which the anatomical masks here do not distinguish. full definition and the ventromedial prefrontal cortex (vmPFC)Definition: ventromedial prefrontal cortex (vmPFC) neuroanatomy The lower middle part of the frontal lobe, linked to the regulation of emotional responses. Here defined by the Harvard-Oxford label Frontal Medial Cortex. Excludes functional definitions from a task, and the dorsal and lateral prefrontal cortex. full definition form a circuit often linked to threat and its regulation. A common hypothesis is that maltreatment in childhood changes this circuit, and that the change shows up as weaker resting-state functional connectivityDefinition: resting-state functional connectivity neuroimaging The correlation over time between the blood-oxygen signals of two brain regions while a person lies in the scanner with no task. Excludes anatomical connections, activity evoked by a task, and the direction of any influence between regions. full definition between the two.
Birn and colleagues [2] studied 27 male combat veterans, 17 of them with PTSD, and modelled amygdala and hippocampus connectivity from childhood maltreatment, combat exposure and PTSD symptoms together. Their abstract reports that scores on the Childhood Trauma Questionnaire (CTQ)Definition: Childhood Trauma Questionnaire (CTQ) clinical psychology A 28-item adult self-report questionnaire about childhood experiences, scored as five subscales (emotional abuse, physical abuse, sexual abuse, emotional neglect, physical neglect) of 5 to 25 each and a total of 25 to 125, plus minimisation items that flag denial. Excludes records of maltreatment from the time it happened, and clinical diagnosis. full definition predicted lower amygdala connectivity to the vmPFC.
Goltermann and colleagues [3] tested the same family of claims in 1,325 adults (624 with major depression, 701 healthy controls), with the CTQ and regions chosen from earlier reports, among them the amygdala. Maltreatment was not associated with the connectivity of any region of interest in the full sample. Within the depressed group, maltreatment went with greater, not weaker, connectivity between the amygdala and dorsolateral frontal areas. The authors conclude that most earlier connectivity correlates of maltreatment did not replicate.
Our study adds a smaller, independent test on open data with one feature the larger study did not state in its abstract: a preregistered smallest effect of interestDefinition: smallest effect of interest statistics (equivalence testing) The size of effect, fixed before the data are seen, below which an effect is treated as too small to matter for the decision at hand. Here a correlation of 0.20 in size. Excludes a claim that smaller effects are zero. full definition and an equivalence test (two one-sided tests)Definition: equivalence test (two one-sided tests) statistics A test that supports the absence of a meaningful effect when the 90 percent interval of the estimate lies wholly inside the band set by the smallest effect of interest, which is the same as rejecting both edges of the band at the 5 percent level. Excludes a test of whether the effect is exactly zero. full definition in the form Lakens [4] describes for correlations. An equivalence test can support "no effect of a size that matters", which a non-significant result alone cannot.
Preregistration and design
The preregistrationDefinition: preregistration research method (metascience) A dated written plan for a study, fixed and hash-locked before any result is seen: the question, the data, the statistic, the controls, the forecasts and the kill conditions. Excludes a plan revised after looking at the outcome, and a protocol written only for the record after the run. full definition was frozen on 9 October 2026, before any phenotype value or image from the dataset was downloaded or viewed. Only file names, the dataset description and the CTQ definitions file had been read. Three choices were made at that point: an anatomical vmPFC, the full sample with no diagnostic filter, and a smallest effect of interest of 0.20 in size, about 4 percent shared variance.
The decision rule had three outcomes, fixed in advance:
- Association: the 95 percent interval excludes 0 and, by a deviationDefinition: deviation research method (metascience) A dated, reasoned change to a preregistered plan, written into the plan's log, with the point in the study at which it was decided. Excludes a silent change to the analysis. full definition logged before any data were processed, the Holm correctionDefinition: Holm correction statistics (multiple testing) A step-down adjustment of p values across a family of tests that keeps the chance of any false positive in the family at the stated level. Excludes adjustment for analyses outside the declared family, such as the exploratory sensitivity checks. full definition-adjusted p across the two registered tests is below 0.05.
- No meaningful association: the 90 percent interval lies wholly inside -0.20 to 0.20.
- Inconclusive: neither.
The preregistration also stated that effects between 0.10 and 0.20 could be missed at the expected sample size, and that any write-up must say so.
Six deviations are logged in the preregistration, each dated with the point at which it was decided:
- 1 to 3, on 9 October, before any participant was processed: keep aCompCor components up to five per mask when fewer are available; require the Holm-adjusted p for an association call; use each session's acquired field maps for distortion correction, with a field-map-free fallback where they do not match.
- 4, on 10 October: a fallback preprocessing path if a software licence was not in place. It was not used; every participant went through one pipeline.
- 5 and its correction 5a, on 10 October, after one participant's motion check and before any trauma or connectivity value was opened: the data are multiband with a 0.8 second repetition time, and breathing showed up as apparent motion. The motion rule became a 0.1 Hz low-pass filter on the motion parameters, with volumes censored above 0.1 mm, following Gratton and colleagues [5]. That rule was validated on single-band data, so here it runs outside its validated setting. Deviation 5 first specified a band-stop filter that did not remove the breathing signal; 5a replaced it.
- 6, on 29 October, after preprocessing and before any trauma-connectivity value was opened, decided from counts of the questionnaire coding only: the dataset codes missing CTQ answers as 88, which the registered code did not list, so 88 became a missing code.
Data and provenance
The data are the Transdiagnostic Connectome Project, OpenNeuro dataset ds005237, snapshot 1.1.3 [1], released under CC0, a public-domain dedication. It is a transdiagnostic adult sample with up to four resting-state runs per participant. This paper reports group statistics only; per-participant tables were not published and no individual record appears here.
All 241 participants were preprocessed with fMRIPrepDefinition: fMRIPrep neuroimaging software An open preprocessing pipeline for functional MRI that corrects head motion and distortion, aligns images to a standard brain space and writes nuisance signals for later cleaning. Excludes the denoising and statistics that follow, which were run by our own code. full definition 25.2.6, with no processing errors. Of these, 230 had four runs, 6 had three and 5 had two. Distortion correction used acquired field maps for 198 participants and the field-map-free method for 43.
The analysed sample of 187 had a mean age of 33.4 years (SD 13.3). It included 112 women, 73 men and 2 people who reported another sex; 122 were scanned at one site and 65 at the other; 114 were in the patient group and 73 in the general-population group. The mean CTQ total was 43.0 (SD 17.3) on a scale of 25 to 125.
Methods
Regions
Regions came from the Harvard-Oxford atlasDefinition: Harvard-Oxford atlas neuroimaging A probabilistic atlas of cortical and subcortical regions in standard brain space. At a 50 percent threshold a voxel belongs to a region when at least half of the reference brains placed it there. Excludes regions drawn from each participant's own anatomy or from functional data. full definition at the 50 percent threshold in standard space: left and right amygdala combined; "Frontal Medial Cortex" for the primary vmPFC target; and "Subcallosal Cortex", the label closest to Brodmann area 25, as the pre-declared secondary target.
Denoising and motion
Each run was cleaned by regression of 24 motion parameters, aCompCorDefinition: aCompCor neuroimaging (denoising) Anatomical component correction: the main components of the signal in white matter and cerebrospinal fluid, where little neural signal is expected, are regressed out as noise. Excludes global signal regression, which removes the mean of the whole brain. full definition (up to five white-matter and five cerebrospinal-fluid components) and cosine drift terms, with no global signal regressionDefinition: global signal regression neuroimaging (denoising) Removing the average signal of the whole brain from every region before connectivity is computed. Excludes aCompCor and motion regression, which remove other nuisance signals. full definition in the primary analysis. Framewise displacementDefinition: framewise displacement neuroimaging (motion quality control) A summary of how far the head moved between two consecutive brain volumes, in millimetres, from the six rigid-body motion parameters. Excludes motion within a single volume. full definition was computed from low-pass filtered motion parameters, and censoringDefinition: censoring neuroimaging (motion quality control) Dropping single brain volumes whose head motion exceeds a threshold before connectivity is computed. Excludes dropping whole runs or whole participants, which follow separate rules. full definition removed volumes above 0.1 mm together with uncensored segments shorter than five volumes. A run was unusable with more than 20 percent of volumes censored, and a participant needed at least two usable runs.
Connectivity
For each usable run , is the Pearson correlation of the mean denoised time series of the two regions. It is converted with the Fisher zDefinition: Fisher z statistics The transform z = artanh(r) of a correlation, which makes its sampling spread close to normal so that correlations can be averaged and given intervals. Excludes any change to the sign or ranking of correlations. full definition transform,
and averaged over the participant's usable runs:
The test
The exposure is the CTQ total, the sum of the five subscales. The statistic is the partial correlationDefinition: partial correlation statistics The correlation between two quantities after the linear effect of a set of covariates has been removed from both. Excludes adjustment for covariates that were not measured, and any statement about cause. full definition between CTQ total and , adjusting for age, sex, site, mean filtered framewise displacement and the number of retained volumes, which the result file records as model terms. Intervals use the Fisher transform of with standard error
and run from to , transformed back to the correlation scale, with 1.96 for the 95 percent interval and 1.645 for the 90 percent interval. With this gives the intervals in Table 1. Statistical powerDefinition: statistical power statistics The chance that a test detects an effect of a stated size, given the sample size and the threshold for significance. Excludes the chance that a detected effect is real. full definition uses the same normal approximation.
Controls and planted checks
The controlDefinition: control statistics and experimental design A version of the data with the structure under test removed (for example shuffled or pooled), scored the same way as the real data, so the real score has something to beat. Excludes a comparison with a different dataset or with a published number. full definition shuffled CTQ totals across participants 10,000 times (seed 20261029) and recomputed the partial correlation each time, giving a null distributionDefinition: null distribution statistics The spread of scores a control gives over many random draws. Its 95th percentile is the bar a real score must clear. Excludes a theoretical distribution assumed rather than drawn from the data. full definition for both the primary and the secondary test. It shows where the observed value sits among values that carry no link by construction.
There is no positive controlDefinition: positive control experimental design A test of a known effect run through the same pipeline, to show that the pipeline can find an effect of the expected kind. Excludes shuffled controls, which show what no effect looks like. full definition. No known effect was planted in the data, and no planted checkDefinition: planted check research method; called a positive control in experimental science Data built so that the right answer is known, run through the same analysis before the real data, to show that the analysis can see the effect when it is there. Excludes any check made on the real data, which cannot show what the analysis misses. full definition shows that this pipeline would find a connectivity effect of size 0.20 when one is present. The equivalence call rests on the interval width, which depends on the sample size and not on the pipeline's sensitivity. A pipeline that destroyed real signal would also produce a narrow interval around zero. This is the main weakness of the design.
Results
Of 241 participants, 17 were excluded for having fewer than two usable runs after motion censoring, 16 had no CTQ record and 21 were missing at least one subscale, leaving 187.
Childhood trauma scores were unrelated to amygdala-vmPFC resting connectivity in 187 adults: partial r -0.006, 95% interval -0.152 to 0.140. The 90% interval, -0.129 to 0.117, lies inside -0.20 to 0.20, so effects of 0.20 or larger in size are excluded at the preregistered bound. The decision is "no meaningful association". The secondary region gave the same decision (Table 1).
- data241 adults with resting scansAll 241 were processed with no processing error. Most had four resting runs.
- measurementMotion rule: 224 kept17 had fewer than two usable runs after high-motion frames were removed.
- measurementTrauma questionnaire: 187 kept16 had no questionnaire record and 21 had no total score.
- measurementPartial r with six covariate termsTrauma total against the strength of the amygdala to frontal medial cortex link at rest.
- controlShuffle controlTrauma scores shuffled across people 10,000 times. The observed value sat at percentile 47.
- rule set in advanceRule: 90% interval inside −0.20 to 0.20Written before the data were analysed. An interval inside the bound excludes effects of that size or larger.
- bound metNo meaningful associationPartial r −0.006, 90% interval −0.129 to 0.117. No known effect was planted, so the pipeline's sensitivity is untested.
Read from registered.json (registered tests and sensitivity analyses). SHA-256 of the run's file 32039389e8721c0fe18e5d73ea9c8b8bcc4d8368578de314783f7963e0089158, published unchanged.
Read from extras.json (shuffle control, power, participant flow). SHA-256 of the run's file 22f520ac2ec8e1506575e2492d91bfbb8e6d758332cb82357253acddb4891821 and of the published copy 367582732b34038561a1f91f38f2b38f5786aa5a6e964f325c135dd6fb078bd9. In the copy, file paths are cut to the file name and the layout (indentation, line endings) may differ; every value is the same.
partial r (0 means no link)
- observed partial r
- shuffled trauma scores, 5th to 95th percentile (tick: median)
- control mean
- no link
Data behind chart 2 2 rows
| Test | n | Observed r | Shuffle 2.5th pct | 5th pct | Median | 95th pct | 97.5th pct | Percentile of observed | Permutation p |
|---|---|---|---|---|---|---|---|---|---|
| Primary, frontal medial cortex | 187 | −0.006 | −0.146 | −0.119 | −0.0006 | 0.124 | 0.147 | 47.06 | 0.93 |
| Secondary, subcallosal cortex | 187 | −0.025 | −0.142 | −0.120 | −0.0001 | 0.124 | 0.149 | 36.76 | 0.73 |
Read from extras.json (shuffle control, power, participant flow). SHA-256 of the run's file 22f520ac2ec8e1506575e2492d91bfbb8e6d758332cb82357253acddb4891821 and of the published copy 367582732b34038561a1f91f38f2b38f5786aa5a6e964f325c135dd6fb078bd9. In the copy, file paths are cut to the file name and the layout (indentation, line endings) may differ; every value is the same.
partial r (0 means no link)
- Partial r with 90% and 95% intervals
- thick bar: 90% interval, the one the rule uses; thin line: 95% interval
- no link
- equivalence region, −0.20 to 0.20
Data behind chart 3 2 rows
| Test | n | Partial r | 90% interval | 95% interval | p | Holm-adjusted p | Decision |
|---|---|---|---|---|---|---|---|
| Primary, frontal medial cortex | 187 | −0.006 | −0.129 to 0.117 | −0.152 to 0.140 | 0.94 | 1.0 | no meaningful association |
| Secondary, subcallosal cortex | 187 | −0.025 | −0.147 to 0.098 | −0.171 to 0.121 | 0.74 | 1.0 | no meaningful association |
Read from registered.json (registered tests and sensitivity analyses). SHA-256 of the run's file 32039389e8721c0fe18e5d73ea9c8b8bcc4d8368578de314783f7963e0089158, published unchanged.
Read from extras.json (shuffle control, power, participant flow). SHA-256 of the run's file 22f520ac2ec8e1506575e2492d91bfbb8e6d758332cb82357253acddb4891821 and of the published copy 367582732b34038561a1f91f38f2b38f5786aa5a6e964f325c135dd6fb078bd9. In the copy, file paths are cut to the file name and the layout (indentation, line endings) may differ; every value is the same.
The unadjusted p values were 0.94 and 0.74. Under the shuffle control the primary value sat at the 47th percentile of 10,000 shuffles (two-sided permutation p 0.93) and the secondary at the 37th (p 0.73), as Figure 1 shows. The shuffled primary values ran from -0.119 to 0.124 between the 5th and 95th percentiles.
Power to detect a correlation of 0.20 was 0.77, so true effects between 0.10 and 0.20 remain open. At the Holm-adjusted threshold the power was 0.68. The smallest correlation detectable with 80 percent power was 0.207. The chance that the equivalence test succeeds when the true correlation is zero was 0.71.
Fifteen exploratory sensitivity analyses moved the primary r between -0.081 and 0.081, and none reached an association. Figure 2 draws all of them with the two registered tests; Table 2 in Appendix A lists them. Thirteen of the fifteen met the equivalence rule on the primary region. The emotional-neglect and physical-abuse subscale analyses, r 0.081 and -0.081, are inconclusive because their 90% intervals touch 0.20. Their 90% intervals run from -0.041 to 0.201 and from -0.202 to 0.042. Each of these single subscales neither shows an association nor excludes one of 0.20.
partial r (0 means no link)
- Inside the bound: no meaningful association
- Reaches the bound: inconclusive
- thick bar: 90% interval, the one the rule uses; thin line: 95% interval
- no link
- equivalence region, −0.20 to 0.20
Data behind chart 4 16 rows
| Analysis | Kind | n | Partial r | 90% interval | 95% interval | Decision |
|---|---|---|---|---|---|---|
| Registered primary test | Registered | 187 | −0.006 | −0.129 to 0.117 | −0.152 to 0.140 | no meaningful association |
| Unfiltered motion rule | Motion and cleaning | 180 | −0.061 | −0.185 to 0.065 | −0.208 to 0.089 | no meaningful association |
| Band-stop motion rule | Motion and cleaning | 131 | −0.047 | −0.194 to 0.101 | −0.221 to 0.129 | no meaningful association |
| Stricter low-pass motion rule | Motion and cleaning | 180 | −0.043 | −0.167 to 0.082 | −0.191 to 0.106 | no meaningful association |
| Global signal regression | Motion and cleaning | 187 | 0.022 | −0.101 to 0.144 | −0.124 to 0.167 | no meaningful association |
| Excluding short aCompCor | Motion and cleaning | 187 | −0.006 | −0.129 to 0.117 | −0.152 to 0.140 | no meaningful association |
| Left amygdala only | Region | 187 | −0.032 | −0.154 to 0.091 | −0.177 to 0.114 | no meaningful association |
| Right amygdala only | Region | 187 | −0.004 | −0.127 to 0.118 | −0.150 to 0.142 | no meaningful association |
| Emotional abuse subscale | Trauma subscale | 190 | 0.035 | −0.087 to 0.156 | −0.110 to 0.179 | no meaningful association |
| Emotional neglect subscale | Trauma subscale | 189 | 0.081 | −0.041 to 0.201 | −0.065 to 0.224 | inconclusive |
| Physical abuse subscale | Trauma subscale | 188 | −0.081 | −0.202 to 0.042 | −0.224 to 0.065 | inconclusive |
| Physical neglect subscale | Trauma subscale | 189 | −0.001 | −0.123 to 0.121 | −0.146 to 0.144 | no meaningful association |
| Sexual abuse subscale | Trauma subscale | 188 | −0.053 | −0.174 to 0.070 | −0.197 to 0.093 | no meaningful association |
| Excluding top minimisation score | Sample | 175 | −0.027 | −0.153 to 0.100 | −0.177 to 0.124 | no meaningful association |
| Adding diagnostic group | Sample | 187 | −0.009 | −0.132 to 0.114 | −0.155 to 0.137 | no meaningful association |
| Excluding any clinical item coded 88 | Sample | 173 | 0.034 | −0.095 to 0.161 | −0.119 to 0.185 | no meaningful association |
Read from registered.json (registered tests and sensitivity analyses). SHA-256 of the run's file 32039389e8721c0fe18e5d73ea9c8b8bcc4d8368578de314783f7963e0089158, published unchanged.
Read from extras.json (shuffle control, power, participant flow). SHA-256 of the run's file 22f520ac2ec8e1506575e2492d91bfbb8e6d758332cb82357253acddb4891821 and of the published copy 367582732b34038561a1f91f38f2b38f5786aa5a6e964f325c135dd6fb078bd9. In the copy, file paths are cut to the file name and the layout (indentation, line endings) may differ; every value is the same.
The same sensitivity analyses were also run on the secondary region. Two of them were inconclusive there: the band-stop motion rule (n 131, r -0.110, 90% interval -0.253 to 0.039) and the sexual-abuse subscale (r -0.098, 90% interval -0.218 to 0.025). None reached an association.
Discussion
The registered result is an honest nullDefinition: honest null research method (our usage) A working test that found no effect beyond a stated bound, a forecast that failed, or an error of our own found and fixed, reported with the same weight as a positive result. Excludes a void run, and a result left unpublished because it was negative. full definition with a stated bound. Within this sample and this measure, the correlation between CTQ total and amygdala-vmPFC resting connectivity is smaller than 0.20 in size. That is consistent with Goltermann and colleagues [3], whose abstract reports no maltreatment association with the connectivity of its regions of interest in 1,325 adults.
It does not contradict Birn and colleagues [2] directly. Their sample was 27 male veterans, most with PTSD, and their model held combat exposure and PTSD symptoms fixed alongside maltreatment; ours is a mixed transdiagnostic sample of women and men (112 and 73), with demographic and motion covariates. An effect confined to a population like theirs could exist and be diluted here. The difference in design is the main reason the two results can both stand.
The inconclusive subscale results deserve plain reporting. Emotional neglect and physical abuse gave correlations of opposite sign, each with a 90 percent interval that crosses 0.20 by a small margin. They come from fifteen exploratory analyses with no correction, so one or two such edges are expected by chance. They do not support an association, and they also do not let us extend the equivalence claim to each subscale.
The deeper limit is the missing positive control. A null from a pipeline never shown to detect a known effect is weaker than a null from one that has. Adding one, for example a well-replicated connectivity difference with age or between homologous regions, is the next step before this pipeline is used for further trauma questions.
Limitations
- One resting-state measure, with anatomical masks, in one transdiagnostic adult sample. Task-evoked regulation and other connectivity methods were not tested.
- The CTQ is retrospective self-report.
- The primary motion rule uses a low-pass filter on framewise displacement outside the single-band data it was validated on.
- There is no positive control, so the pipeline's ability to find a known effect is not shown.
- A true correlation between 0.10 and 0.20 in size could give this result; power at 0.20 was 0.77.
- Two subscale analyses on the primary region and two analyses on the secondary region were inconclusive.
- The analysis was run by our own code and was not blind.
Evidence
Honest null. Correlations of 0.20 or larger in size are excluded at the preregistered bound (90 percent interval -0.129 to 0.117); true effects between 0.10 and 0.20 remain open.
Figures
These are the paper's own figures, numbered as in the PDF, and each "Figure" reference in the text points here. The charts on this page redraw the same results from the result files and carry their own numbers.
Tables
| Test | n | Partial r | 95% interval | 90% interval | Holm p |
|---|---|---|---|---|---|
| Primary, frontal medial cortex | 187 | -0.006 | -0.152 to 0.140 | -0.129 to 0.117 | 1.0 |
| Secondary, subcallosal cortex | 187 | -0.025 | -0.171 to 0.121 | -0.147 to 0.098 | 1.0 |
Appendix A. Sensitivity analyses on the primary region
All fifteen were declared as exploratory, most of them in the preregistration body and the rest in the deviation log. The decision column applies the registered rule to each.
| Analysis | n | Partial r | 90% interval | Decision |
|---|---|---|---|---|
| Unfiltered motion rule | 180 | -0.061 | -0.185 to 0.065 | no meaningful |
| Band-stop motion rule | 131 | -0.047 | -0.194 to 0.101 | no meaningful |
| Low-pass rule at 0.08 mm | 180 | -0.043 | -0.167 to 0.082 | no meaningful |
| Global signal regression | 187 | 0.022 | -0.101 to 0.144 | no meaningful |
| Left amygdala only | 187 | -0.032 | -0.154 to 0.091 | no meaningful |
| Right amygdala only | 187 | -0.004 | -0.127 to 0.118 | no meaningful |
| Emotional abuse subscale | 190 | 0.035 | -0.087 to 0.156 | no meaningful |
| Emotional neglect subscale | 189 | 0.081 | -0.041 to 0.201 | inconclusive |
| Physical abuse subscale | 188 | -0.081 | -0.202 to 0.042 | inconclusive |
| Physical neglect subscale | 189 | -0.001 | -0.123 to 0.121 | no meaningful |
| Sexual abuse subscale | 188 | -0.053 | -0.174 to 0.070 | no meaningful |
| Excluding top minimisation score | 175 | -0.027 | -0.153 to 0.100 | no meaningful |
| Excluding short aCompCor | 187 | -0.006 | -0.129 to 0.117 | no meaningful |
| Adding diagnostic group | 187 | -0.009 | -0.132 to 0.114 | no meaningful |
| Excluding any clinical item coded 88 | 173 | 0.034 | -0.095 to 0.161 | no meaningful |
Numbers recorded in our publication register
| What | Value |
|---|---|
| Sample | n 187 of 241 (17 motion, 16 no CTQ, 21 missing subscale) |
| Main estimate and interval | r -0.006, 95% CI -0.152 to 0.140, 90% CI -0.129 to 0.117 |
| Forecast against outcome | decision rule set before data; outcome no meaningful association |
| Known-answer check | none (no positive control for connectivity) |
As recorded in the publication register, the summary row each finding gets; the paper's own numbers above were re-read from the result files.
What lowers it
- blinding Not blind. The questionnaire's code 88 for a missing answer was handled before the outcome was opened. from our publication register, on blinding
- missing control No positive control. from our publication register, on the known-answer check
- imprecision Correlations of 0.20 or larger in size are excluded at the preregistered bound (90 percent interval -0.129 to 0.117); true effects between 0.10 and 0.20 remain open. from the bound stated under Evidence
- novelty Nearby work exists; novelty is not shown. from our publication register, on the literature
- depth of reading The cited literature was read at the level of abstracts and publisher or repository pages; full texts were not read. from the Verified section
What holds it up
- scoring Scored by code against rules fixed in advance. from our publication register, on who scored it
- control Controls: working: 10,000 permutations, 47th percentile; 15 exploratory sensitivities r -0.081 to 0.081. from our publication register, on controls
- open data Public data. from our publication register, on the data licence
Where the claim stands
- lead
- hypothesis
- thesis
- conjecture
- theorem
- law candidate
- killed
A preregistration with pass-or-fail rules is on file, which this rung needs. The next rung needs a named rival reading beaten by a decisive observation, and none is on file. Tier D: A clean registered equivalence null on real CC0 data with a shuffled control. A larger null already exists, so it adds a replication and a specific equivalence bound. Power 0.77 at the bound, modest.
Trail
Versions
- v3 2026-11-14, this page corrected, 1 item; the PDF and its BuildTeX source are still paper version 1.0
- v2 2026-11-09, paper version 1.0, first published PDF sha256 656e5d6d455e965c
- v1 2026-10-29, entered in the findings ledger
Corrections
2026-11-14 wording found by a review of the published pages
A review of the published page found two unclear phrases. now The charts spoke of six covariates while the text names five variables; the result file records six model terms built from those five, and the charts now say so. The discussion described the sample as mostly women and men; it holds 112 women, 73 men and 2 people who reported another sex.
2026-11-09 scope found by the publication pass
The findings ledger said of the fifteen sensitivity analyses only that none reached an association. now The emotional-neglect and physical-abuse subscale analyses (r 0.081 and -0.081) are inconclusive, their 90% intervals touching 0.20. This paper reports them that way, and also reports the two inconclusive secondary-region analyses.
2026-10-10 wording found by the study itself, before publication
Deviation 5 contained an error; its supporting numbers came from a low-pass check while its rule named a band-stop filter. now Deviation 5a corrected it before any trauma or connectivity value was opened.
Each correction is a dated note; the findings ledger is never rewritten, and a note governs where it differs.
Ledger and version dates up to publication are local dates in US Pacific time. Clock times in the text are UTC, seven or eight hours ahead, so a lock or a run stamped just after midnight UTC belongs to the previous local day. Corrections from 14 November 2026 on are dated in UTC.
References
- Transdiagnostic Connectome Project. OpenNeuro dataset ds005237, snapshot 1.1.3. CC0. doi:10.18112/openneuro.ds005237.v1.1.3 run here Licence: CC0 (OpenNeuro ds005237); per-participant tables held back used in Data and provenance
- Birn, R. M., Patriat, R., Phillips, M. L., Germain, A. and Herringa, R. J. (2014). Childhood maltreatment and combat posttraumatic stress differentially predict fear-related fronto-subcortical connectivity. Depression and Anxiety 31, 880-892. doi:10.1002/da.22291 abstract or summary, 2026-11-09: abstracts and publisher or repository pages; full text not read used in Introduction, Discussion
- Goltermann, J., Winter, N. R., Meinert, S., Sindermann, L., Lemke, H., Leehr, E. J. and others (2022). Resting-state functional connectivity patterns associated with childhood maltreatment in a large bicentric cohort of adults with and without major depression. Psychological Medicine, online 27 June 2022. doi:10.1017/S0033291722001623 abstract or summary, 2026-11-09: abstracts and publisher or repository pages; full text not read used in Introduction, Discussion
- Lakens, D. (2017). Equivalence tests: a practical primer for t tests, correlations, and meta-analyses. Social Psychological and Personality Science 8, 355-362. doi:10.1177/1948550617697177 abstract or summary, 2026-11-09: abstracts and publisher or repository pages; full text not read used in Introduction
- Gratton, C., Dworetsky, A., Coalson, R. S., Adeyemo, B., Laumann, T. O., Wig, G. S. and others (2020). Removal of high frequency contamination from motion estimates in single-band fMRI saves data without biasing functional connectivity. NeuroImage 217, 116866. doi:10.1016/j.neuroimage.2020.116866 abstract or summary, 2026-11-09: abstracts and publisher or repository pages; full text not read used in Preregistration and design
Cited by later findings
- No later record in the findings ledger treats this finding.
Reproduce
Data
- Transdiagnostic Connectome Project. Licence: CC0 (OpenNeuro ds005237); per-participant tables held back. https://doi.org/10.18112/openneuro.ds005237.v1.1.3
Steps
- Data: download OpenNeuro ds005237, snapshot 1.1.3 (CC0).
- Preprocess with fMRIPrep 25.2.6 into standard space. Denoise with 24 motion parameters, aCompCor and cosine terms. Censor volumes with low-pass filtered framewise displacement above 0.1 mm and segments shorter than five volumes; drop runs with more than 20 percent censored; keep participants with at least two usable runs.
- Extract mean time series from the Harvard-Oxford amygdala and Frontal Medial Cortex masks at the 50 percent threshold, correlate, apply eq. 1 and average with eq. 2.
- Sum the five CTQ subscales, treating 88 as missing. Compute the partial correlation with the six covariate terms and its intervals with eq. 3, then apply the decision rule at 0.20.
- Shuffle CTQ totals 10,000 times with seed 20261029 for the null.
- Preregistration, frozen body SHA-256: 4d4681b9f44188b37e60fd9c53d94a85e01cd1529f4d2be7228a42a3ff36f753. Current file with the deviation log: f185c72a449a8649dda7177a3c93a4107da54bc243b4001edd439ad8cceadb82. This study ran before we used our study-running tool, which records a plan hash and a run id, so it has no plan hash or run id; the result files carry the frozen hash and the SHA-256 of every phenotype input.
Cost. The analysis session used 50.4 kJ (14.0 Wh), measured at the machine. The 19-day preprocessing batch was not metered. The study was not re-run.
Downloads
- Whitepaper, PDF F50.pdf, 578 KB
- BuildTeX source F50.bld, 33 KB
- Build receipt F50.buildtex.json, 1 KB
- BuildLang doc module doc.bld, 5 KB, imported by the source
The PDF is typeset by BuildTeX from F50.bld, which is written from the same source as this page. The receipt records the source's SHA-256 and the PDF's (656e5d6d455e), so anyone can rebuild it and compare. The copy here has its hidden author field blanked, as the site does for every file it publishes; blank the same field in a rebuild before comparing. The name stays on the first page.
Verified
Verified on 2026-11-09. On 9 November 2026 the flow counts (241, 17, 16, 21, 187), the primary and secondary correlations with their 95% and 90% intervals, the unadjusted and Holm p values, the permutation percentiles, p values and quantiles, the power values, all fifteen sensitivity analyses on both regions, and the group descriptions of the sample were re-read from the study's two group-level result files. They match the findings ledgerDefinition: findings ledger our records The append-only, dated list of every result we have recorded, numbered F1, F2 and on. Corrections are added as new dated lines and old entries are never rewritten. Excludes a curated list of successes. full definition, with the dated correction of 9 November for the two subscale analyses. The interval formula was read from the analysis script and agrees with the reported primary interval. The frozen preregistration hash recorded in both result files matches the hash in the study's hash register. Both figures were drawn by a script that reads only the two result files. For Gratton and colleagues [5], the preregistration records that its methods section was read on 10 October 2026.
Not checked. The current preregistration file has a different SHA-256 because the deviation log was appended after freezing; the frozen body was not re-hashed for this paper. The study was not re-run. The literature was found by searches run on 9 November 2026 and read at the level of abstracts and publisher or repository pages; the full texts were not read.
Terms on this page
Each term is defined where it is first used on this page. Each name below opens its entry in the findings glossary, which lists every page that uses it.
- amygdala neuroanatomy first use
- ventromedial prefrontal cortex (vmPFC) neuroanatomy first use
- resting-state functional connectivity neuroimaging first use
- Childhood Trauma Questionnaire (CTQ) clinical psychology first use
- smallest effect of interest statistics (equivalence testing) first use
- equivalence test (two one-sided tests) statistics first use
- preregistration research method (metascience) first use
- deviation research method (metascience) first use
- Holm correction statistics (multiple testing) first use
- fMRIPrep neuroimaging software first use
- Harvard-Oxford atlas neuroimaging first use
- aCompCor neuroimaging (denoising) first use
- global signal regression neuroimaging (denoising) first use
- framewise displacement neuroimaging (motion quality control) first use
- censoring neuroimaging (motion quality control) first use
- Fisher z statistics first use
- partial correlation statistics first use
- statistical power statistics first use
- control statistics and experimental design first use
- null distribution statistics first use
- positive control experimental design first use
- planted check research method; called a positive control in experimental science first use
- honest null research method (our usage) first use
- findings ledger our records first use
To report an error, name the finding, the claim number and the source on the Work page, which gives the address. Accepted corrections join the Trail with their date.