
Findings F39 Music and sound, Psychology and perception found 2026-10-29
Music with long ringing tails and dark spectra is rated calmer, and also less pleasant
Across 502 held-out music clips by 270 artists, sounds that ring on longer and lean toward low frequencies were rated lower in arousal, beyond loudness, genre and year. We forecast they would also be rated more pleasant; they were rated less pleasant instead.
- Tier
- B*, strong signal
- Outcome
- held
- Rung
- hypothesis
- Verdicts
- 7 passed, 2 failed
- Corrections
- 5, latest 2026-11-14
- Version
- v3, 2026-11-14
- Redo it
- Reproduce
Download PDF 584 KB BuildTeX source F39.bld
What this means for a reader
Music that rings on and sounds dark is heard as calmer, across every genre in the set. It is also rated less pleasant. If you build a playlist to relax, music with these two properties was rated calmer, and it was also rated less pleasant; the study did not change the sound of any clip, so it does not show that adding them causes either. The ratings describe what listeners judged the music to express, and say nothing about what it made them feel.
Objection
Tail is a proxy for instrumentation and production style, since timbre was not held; DEAM is short clips with crowd perceived-emotion ratings. The register lists a third point, on where the audio copies came from, and its text is cut short there.
What would change the call. Replicate on a second rated corpus, add a blind listening test with tail manipulated at fixed instrumentation, and measure felt calm.
From the strongest objection recorded in our publication register.
Abstract
People often reach for music with long, ringing sustain and a warm, dark tone when they want to wind down. We asked whether those two properties of the sound go with how calm and how pleasant listeners judge a clip to be, beyond loudness, genre and year. On 1,744 rated 45-second clips from the DEAM dataset, we measured how long each note rings after its onset and how far the spectrum leans toward low frequencies, and tested the link on 502 clips by 270 artists kept out of all fitting. A calm index built from a longer tail and a darker spectrum correlates -0.394 with rated arousal (95% interval -0.476 to -0.304), with loudness, genre and year held fixed. Adding the two measures raises held-out explained variance in arousal by 0.110 (0.034 to 0.182). We forecast that the same sounds would be rated more pleasant; they were rated less pleasant, -0.375 (-0.455 to -0.280), and -0.227 with arousal also held. In these ratings, calm sits closer to subdued than to content.
c1 observed, evidence for claim 1
- The numbers in claim 1
- -0.394; 95; -0.476; -0.304 matches the result file, 2026-11-09
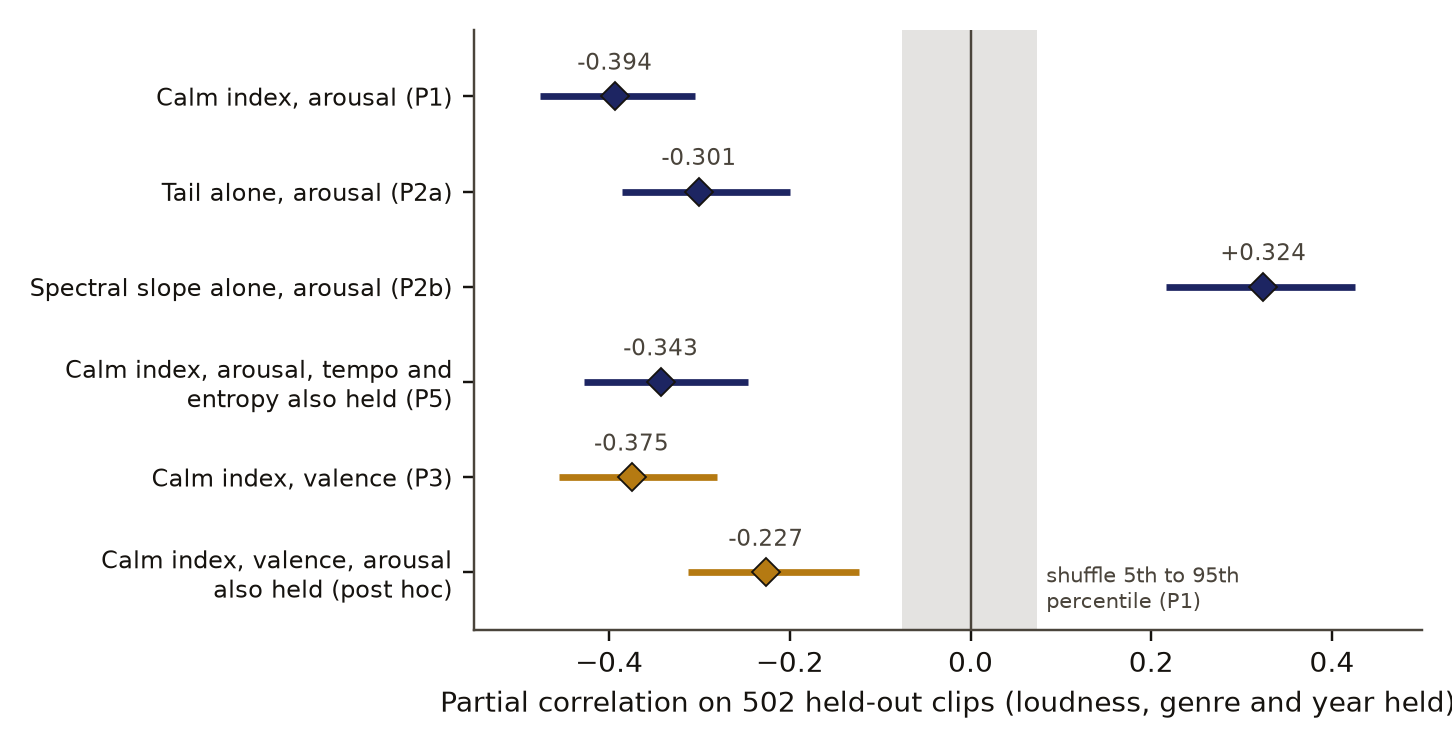
- Chart 2
- Calmer-sounding clips are rated less energetic, and also less pleasant.
- Basis
- observed: measured in this study, with a result file
c2 observed, evidence for claim 2
- The numbers in claim 2
- 0.110; 0.034; 0.182 matches the result file, 2026-11-09
- Chart 3
- What the tail and the spectral slope add to predicting arousal on clips the model had not seen.
- Basis
- observed: measured in this study, with a result file
c3 observed, evidence for claim 3
- The numbers in claim 3
- -0.375; -0.455; -0.280; -0.227 matches the result file, 2026-11-09
- Chart 2
- Calmer-sounding clips are rated less energetic, and also less pleasant.
- Basis
- observed: measured in this study, with a result file
Introduction and motivation
The acoustic side of musical emotion has mostly been studied on single notes. Eerola, Ferrer and Alluri [2] had listeners rate isolated instrument sounds for valence, tension and energy and found that features such as attack time and spectral brightness tracked those ratings. Korsmit and colleagues [3] pooled several such datasets and found that some acoustic links held across them and others did not. These studies hold the musical context fixed by removing it.
Reverberation has its own small literature. Mo, Wu and Horner [4] added reverberation to eight wind and bowed-string sounds and found that its length shifted their emotional character, most strongly toward romantic and mysterious and less toward sad. Wilkie and Harrison [5] varied reverberation time in recorded music heard over headphones and found that longer reverberation raised ratings of sublimity, nostalgia and wonder while leaving unease and vitality about the same.
We asked a question one step further from the laboratory: in full mixed music by many artists, does a longer ringing tail after each note and a darker spectrum go with lower rated arousal, beyond loudness and genre, on artists the analysis never saw? We also asked, more tentatively, whether the same sounds would be rated as more pleasant. The decision this informs is which acoustic controls a music tool can trust to move perceived calm, and what else they move with it.
Searches run on 9 November 2026 found the DEAM benchmark paper [1], the studies above and related work on isolated tones. They returned nothing that measures an onset-locked tail in full mixed music. That is what the searches returned; it does not show that no such study exists.
Preregistration and design
The preregistrationDefinition: preregistration research method (metascience) A dated written plan for a study, fixed and hash-locked before any result is seen: the question, the data, the statistic, the controls, the forecasts and the kill conditions. Excludes a plan revised after looking at the outcome, and a protocol written only for the record after the run. full definition, a dated plan hash-locked before any result is seen, was written on 29 October 2026 and locked at 16:24 UTC. Acoustic features were extracted from the audio before the lock. No rating was joined to any feature before it; while checking copies of the annotation file, the first two rows (two clips) were seen and nothing else of the ratings.
The plan fixed the data, the measures that had passed an instrument check, the artist split, the controls, the predictions and the rule for each verdictDefinition: verdict research method (our usage) The pass or fail of one preregistered rule set against the run's numbers, read off by code. Excludes an interpretation written after reading the numbers. full definition, which is the pass or fail of one preregistered rule set read off by code. Every rule is fail-closed: a verdict passes only when all of its rules hold. The predictions were:
- P1, primary: the calm index correlates negatively with arousal on the test clips, its interval excludes zero, and it lies below the 5th percentile of a shuffle control.
- P2a and P2b: the tail alone correlates negatively with arousal, and the spectral slope alone positively, each with an interval excluding zero.
- P3, stated as possible: the calm index correlates positively with valence, its interval excludes zero, and it lies above the 95th percentile of a shuffle control.
- P4: adding the tail and the slope to the controls raises explained variance in arousal on the test clips, with an interval above zero and above the 95th percentile of a shuffle control.
- P5: P1 still holds with tempo and spectral entropy added to the controls.
The forecasts written before the run were a P1 correlation near -0.15 (range -0.05 to -0.30) and a P3 correlation near +0.05, likely to fail. The same plan also held two questionnaire tests on music absorption and personality. Their values were seen before the lock through a test of the analysis code, so they are not blind tests, and they are left out of this paper.
One change came after the lock and before feature extraction: the audio loader switched from an FFT resampler to a polyphase one. The instrument check's synthetic clips are made at the analysis rate and never pass through the loader, so the check is unaffected.
Data and provenance
The data are DEAM, the MediaEval Database for Emotional Analysis in Music [1]. It holds Creative Commons music from the Free Music Archive, Jamendo and MedleyDB, with ratings from crowd workers. The release is licensed CC BY-NC, non-commercial use with attribution; this paper reports statistics only and redistributes no audio or ratings.
The ratings are arousal and valenceDefinition: arousal and valence psychology of emotion (the circumplex model) Two rating scales for emotion: arousal runs from calm to excited and valence from unpleasant to pleasant. In DEAM each is a nine-point scale averaged over crowd raters. Excludes named emotions such as sadness or nostalgia, which the ratings place only as points on the two scales. full definition: arousal runs from calm to excited and valence from unpleasant to pleasant, each on a nine-point scale averaged over raters for each clip. They measure perceived emotionDefinition: perceived emotion music psychology The emotion a listener judges the music to express, as opposed to the emotion the listener feels. Excludes felt or induced emotion, physiological response and any change in mood or symptoms. full definition, what a listener judges the music to express, and not what the listener feels.
We used the 1,744 clips of 45 seconds from the 2013 and 2014 rating rounds, by 899 artists. The 58 full songs from 2015 were left out because their length, rater pool and rating method differ. Genre comes from the dataset's metadata: 11 sampling genres, with one clip under another label pooled as Other.
The official host refused connections on the day of download. The audio came from a public mirror; the archive holds 1,802 files, the count the dataset paper gives, but there is no official checksum to compare it with. The per-clip annotations came from three independent public copies with identical bytes. The metadata is the official file, retrieved through the Internet Archive. The mirror's provenance is a limit, stated below.
Methods
Measures
Each clip was converted to mono at 22,050 Hz and cut to its first 45 seconds. The energy envelope is the root mean square over 256-sample windows at a 64-sample hop.
The onset-locked tailDefinition: onset-locked tail audio signal processing (our measure) For each note onset found in the energy envelope, the time constant of the envelope's decay from its peak to the next minimum, with the median taken over onsets. It follows whichever of the note's own decay and the room's decay is slower. Excludes the reverberation time of the room on its own, which this measure cannot separate in dense music. full definition is a decay time measured after each note onset. Onsets are envelope peaks at least 0.1 s apart and above the envelope's 60th percentile. For each onset, the log envelope from the peak to the next minimum is fitted by least squares against time, giving a slope . Each onset with a negative slope gives a decay time constant in seconds,
and the tail is the median of over those onsets. This follows whichever of the note's own decay and the room's decay is slower. In dense music it cannot separate the two.
The spectral slopeDefinition: spectral slope audio signal processing The slope of log power against log frequency between 110 Hz and 5.5 kHz. A more negative slope means energy leans toward low frequencies and the sound is darker. Excludes pitch, loudness and the shape of the spectrum beyond its overall tilt. full definition is the least-squares slope of power against frequency from a Welch spectrum, between 110 Hz and 5.5 kHz. A more negative slope means a darker sound.
The calm index combines the two, with each measure standardised by its mean and standard deviation on the training clips only:
A higher means a longer tail and a darker spectrum.
Split
Artists were put in a random order with a fixed seed, and 30 percent of them, with all their clips, form the held-out test setDefinition: held-out test set statistics and machine learning Data kept apart from everything that was fitted or standardised, here every clip by 30 percent of the artists, so that a result on it is a check on new material. Excludes data used to fit the model, choose a threshold or compute a scaling. full definition: 502 clips by 270 artists. The other 1,242 clips are the training set. Every verdict reads the test set.
Statistics
The controls in every confirmatory model are loudness in decibels relative to full scale, 11 genre indicators and rating year, with an intercept. The main statistic is the partial correlationDefinition: partial correlation statistics The correlation between two quantities after each has had the linear effect of a set of control variables removed by least squares. Excludes a causal effect, and any non-linear dependence on the controls. full definition: each of the two quantities is regressed on the controls by least squares, and the residuals and are correlated, with sums over the clips:
Residuals from a fit with an intercept have mean zero, so this is the ordinary correlation of the residuals.
The held-out R2 gainDefinition: held-out R2 gain statistics The share of variance in the test outcome explained by a model fitted on training data with the added measures, minus the same share for the model without them. Excludes the in-sample R2 of a fit, which can only grow as variables are added. full definition fits arousal on the training clips twice, once on the controls and once on the controls plus and , and scores both fits on the test clips:
where is a fit's prediction for a test clip, the mean test rating, the test score of the controls-only fit, that of the fit with the two measures, and the gain.
Intervals are 95% intervalsDefinition: 95% interval statistics The range that holds the middle 95 percent of the bootstrap or control draws for a number. We report it beside the number. Excludes a statement that the true value lies inside with 95 percent probability. full definition, the 2.5th to 97.5th percentiles of 2,000 cluster bootstrapDefinition: cluster bootstrap statistics A bootstrap that resamples whole groups, here artists with all their clips, so that clips by one artist count as one draw. Excludes a bootstrap over single clips, which treats one artist's clips as independent. full definition resamples of the test set, where whole artists are drawn with replacement.
Controls and planted checks
Instrument check on synthetic music
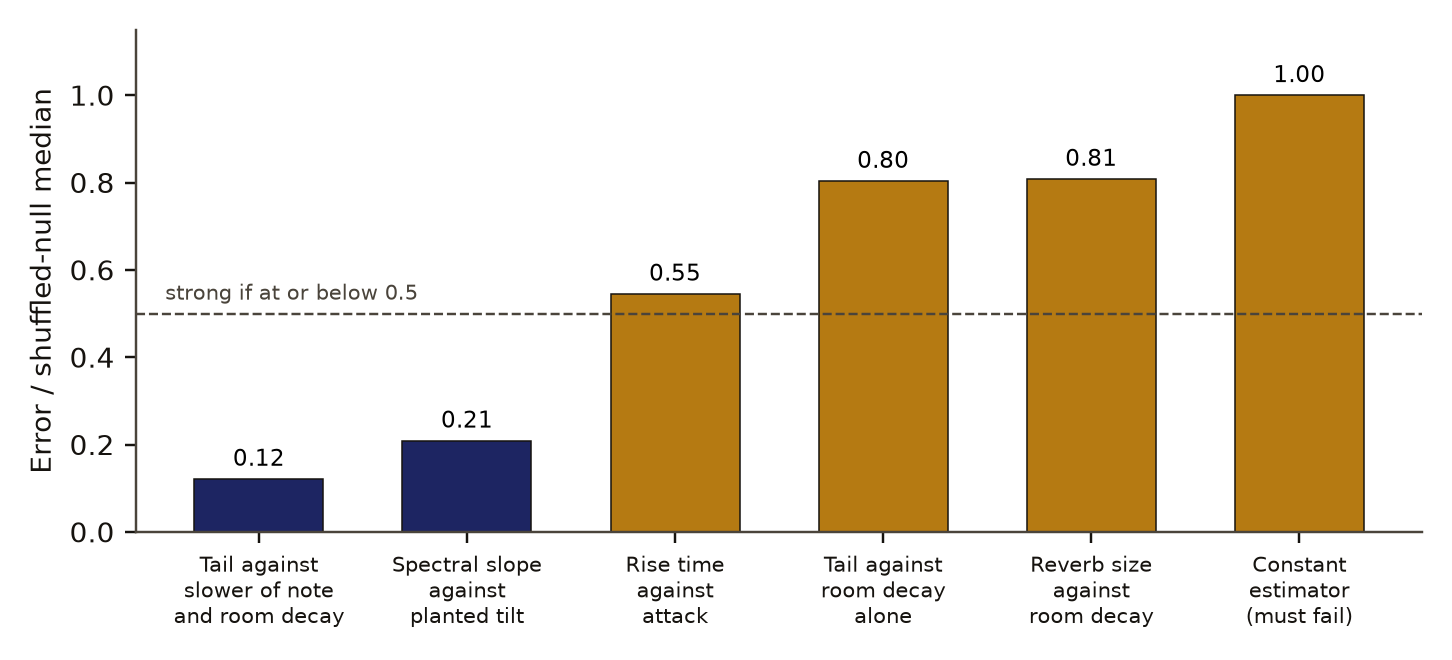
Before the lock, every measure was run as a planted checkDefinition: planted check research method; called a positive control in experimental science Data built so that the right answer is known, run through the same analysis before the real data, to show that the analysis can see the effect when it is there. Excludes any check made on the real data, which cannot show what the analysis misses. full definition: synthetic music built so that the right answer is known. Each of 40 clips held 30 seconds of harmonic notes on a beat, with room decay time, note decay, attack, tempo, spectral tilt and wet mix set at random and varying at once. Each measure's median error was compared with the error of the same measure against shuffled targets. A measure counted as strong when it beat the shuffled targets' 5th percentile and its median error was at most half the shuffled median. The ratio of the two medians is in Figure 1.
The tail recovered the slower of note and room decay with an error ratio of 0.12 and a rank correlation of 0.95; the spectral slope recovered the planted tilt with 0.21 and 0.99. The library's reverb-size measure failed in dense music (0.81), and the tail against room decay alone failed too (0.80), so room reverberation cannot be separated from note decay with these tools and enters no verdict. The best attack measure reached 0.55, short of strong, so attack enters no verdict either. A constant estimator, included as a false-success check, scored 1.00 and failed, as it must.
c4 observed, evidence for claim 4
- The numbers in claim 4
- 0.12; 0.95; 0.21; 0.99 matches the result file, 2026-11-09
- Chart 1
- How well each sound measure recovers values planted in synthetic music.
- Basis
- observed: measured in this study, with a result file
Shuffle controls
Each controlDefinition: control statistics and experimental design A version of the data with the structure under test removed (for example shuffled or pooled), scored the same way as the real data, so the real score has something to beat. Excludes a comparison with a different dataset or with a published number. full definition removes the structure under test and is scored the same way as the real data. For P1 and P3, the calm index was shuffled across test clips 1,000 times and the partial correlation recomputed each time; the spread of those draws is the null distributionDefinition: null distribution statistics The spread of scores a control gives over many random draws. Its 95th percentile is the bar a real score must clear. Excludes a theoretical distribution assumed rather than drawn from the data. full definition. For P4, the tail and slope rows were shuffled within the training set and within the test set, 1,000 times, and the whole fit repeated. Table 1 gives the bars.
Results
Figure 2 and Table 2 give the confirmatory results on the 502 test clips. A calm index built from a longer tail and a darker spectrum correlates -0.394 with rated arousal (95% interval -0.476 to -0.304), with loudness, genre and year held fixed. That is far outside the shuffle range and about 2.6 times the size forecast. Each measure carries the link on its own: the tail at -0.301 and the slope at +0.324, where a higher slope means a brighter sound.
partial correlation (below 0: higher score, lower rating)
- Against rated arousal
- Against rated valence
- 95% bootstrap interval over artists
- no relation
- shuffled calm index, 5th to 95th percentile
Data behind chart 2 9 rows
| Rating | Measure | Partial correlation | 95% low | 95% high | Kind |
|---|---|---|---|---|---|
| Rated arousal | Calm index | −0.394 | −0.476 | −0.304 | planned test |
| Rated arousal | Tail alone | −0.301 | −0.386 | −0.200 | planned test |
| Rated arousal | Spectral slope alone (higher is brighter) | +0.324 | +0.217 | +0.426 | planned test |
| Rated arousal | Calm index, tempo and entropy also held | −0.343 | −0.428 | −0.246 | planned test |
| Rated arousal | Calm index, note rate also held | −0.370 | −0.444 | −0.284 | post hoc |
| Rated valence | Calm index | −0.375 | −0.455 | −0.280 | planned test, forecast above 0 |
| Rated valence | Calm index, arousal also held | −0.227 | −0.312 | −0.123 | post hoc |
| Shuffle control, arousal | Calm index shuffled | −0.000 | −0.076 | +0.074 | 5th to 95th percentile of 1,000 shuffles |
| Shuffle control, valence | Calm index shuffled | −0.002 | −0.078 | +0.077 | 5th to 95th percentile of 1,000 shuffles |
Read from result.json (confirmatory run), run 20261029T162517Z. SHA-256 of the run's file f17c7c5c9bc2211612e56197e0f3e5429414ff659d08e8e124ea3c07c923dbee and of the published copy b8dfb3f6e0023961dd9c74fc855b76c86c676210791f4ba540e7863158cf72cd. In the copy, file paths are cut to the file name and the layout (indentation, line endings) may differ; every value is the same.
Read from posthoc.json (checks run after the verdicts). SHA-256 of the run's file 6707855c36a75a5fda9a7f21030621d2276a3db759094d2aa194527a9243215f, published unchanged.
Adding the two measures raises held-out explained variance in arousal by 0.110 (0.034 to 0.182). The controls alone explain 0.160 of the test variance. With tempo and spectral entropy added to the controls, the calm index still correlates -0.343 with arousal.
gain in held-out explained variance (higher is a larger gain)
- Real tail and slope added
- Shuffled tail and slope added (control)
- 95% bootstrap interval over artists for the real measures; 5th to 95th percentile of the shuffles for the control
- no gain
Data behind chart 3 3 rows
| Model | Value | Low | High | Range is |
|---|---|---|---|---|
| Loudness, genre and year alone: explained variance | 0.160 | no interval in the result file | ||
| Gain from real tail and slope | 0.110 | 0.034 | 0.182 | 95% bootstrap interval over artists |
| Gain from shuffled tail and slope | −0.001 | −0.008 | +0.003 | 5th to 95th percentile of 1,000 shuffles |
Read from result.json (confirmatory run), run 20261029T162517Z. SHA-256 of the run's file f17c7c5c9bc2211612e56197e0f3e5429414ff659d08e8e124ea3c07c923dbee and of the published copy b8dfb3f6e0023961dd9c74fc855b76c86c676210791f4ba540e7863158cf72cd. In the copy, file paths are cut to the file name and the layout (indentation, line endings) may differ; every value is the same.
We forecast that the same sounds would be rated more pleasant; they were rated less pleasant, -0.375 (-0.455 to -0.280), and -0.227 with arousal also held. P3 failed on all three of its rules. This is an honest nullDefinition: honest null research method (our usage) A working test that found no effect beyond a stated bound, a forecast that failed, or an error of our own found and fixed, reported with the same weight as a positive result. Excludes a void run, and a result left unpublished because it was negative. full definition of the forecast, reported with the same weight as the passes: arousal and valence correlate 0.54 on the test clips, so part of the valence drop rides on arousal, and the rest (-0.227, interval -0.312 to -0.123) does not.
Post hoc checks
The following were run after the verdicts and carry no verdict. In busy music the next onset cuts each tail short, so the tail could stand in for note rate. Note rate has a median of 4.9 events per second and correlates -0.17 with the log tail. With note rate added to the controls, P1 is -0.370 (-0.444 to -0.284) and the tail alone -0.285; with note rate, tempo and entropy all added, P1 is -0.324.
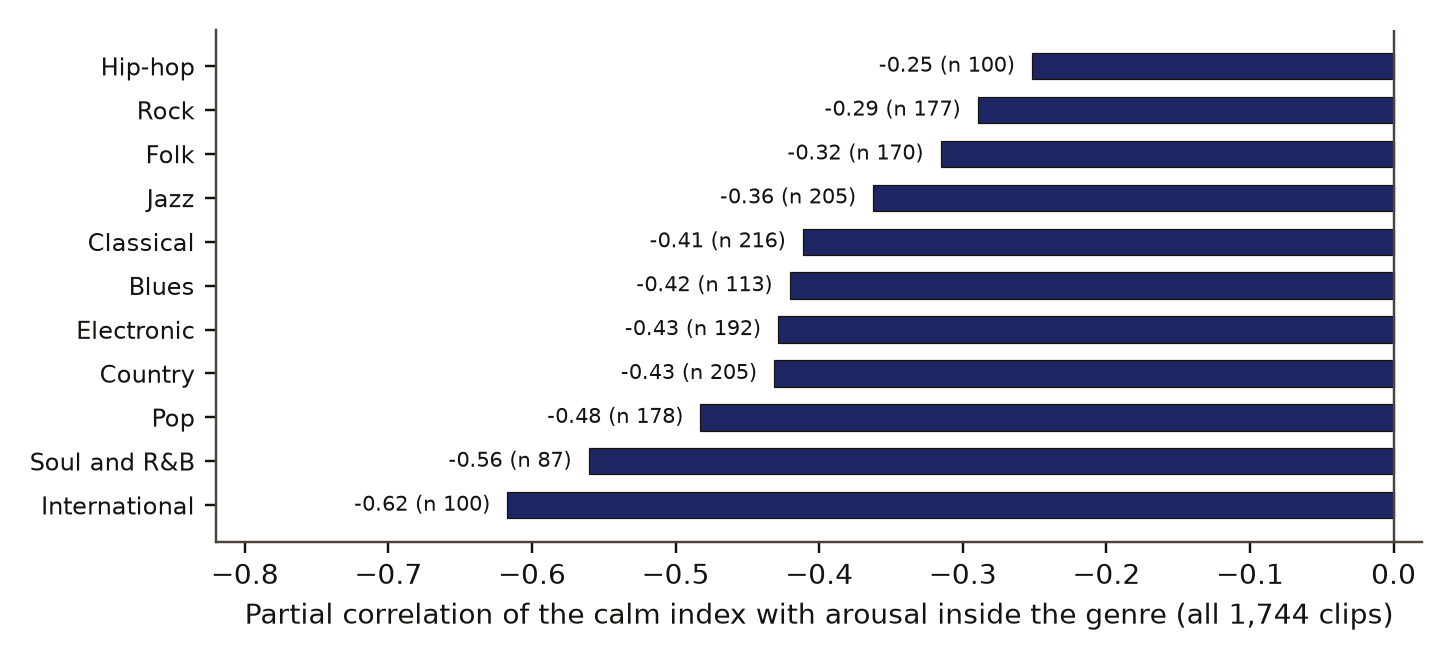
Inside each of the 11 genres, on the 1,743 clips they hold (one clip tagged Other is left out), the calm index correlates negatively with arousal, from -0.25 in hip-hop to -0.62 in international music. Figure 3 shows each genre.
c5 observed, evidence for claim 5
- The numbers in claim 5
- 11; 1,743; -0.25; -0.62 matches the result file, 2026-11-09
- Chart 4
- The same link inside each genre (post hoc, run after the verdicts).
- Basis
- observed: measured in this study, with a result file
On the whole sample, P1 is -0.414 and the valence correlation -0.395. Among exploratory measures on the test clips, the failed reverb-size measure reads in the same direction as the tail (partial correlation with arousal -0.237), and so does the envelope's autocorrelation decay (-0.198); neither can be read as room reverberation. Rise time shows no relation (0.024), which is a null of a weak instrument and says nothing about attack itself.
Discussion
The arousal result agrees with what single-note studies found for brightness [2] [3] and extends it to full mixes by many artists, on artists held out from fitting, with a tail measure checked on synthetic music before use. The size, about -0.39, is larger than we forecast. It survives tempo, spectral entropy and note rate, and holds inside every genre.
The valence result is the more interesting one. A reader might expect calm music to be rated pleasant. In DEAM it is rated less pleasant, and the drop is not only the shared variance with arousal. Wilkie and Harrison [5] found that longer reverberation raised sublimity and nostalgia and left unease and vitality about the same, and Mo, Wu and Horner [4] found reverberation moved instrument sounds toward romantic and mysterious and, less strongly, sad. Both fit a reading in which long dark tails carry a wistful or melancholy calm.
For a music tool, the practical reading is that a sustain or darkness control may move perceived calm and lower perceived pleasantness together, which a test that changes the sound would have to confirm. A tool that offers calm through these controls should say so.
The tierDefinition: tier our publication register How ready a finding is to publish: A candidate, B signal worth expanding (B* strong), C internal, D honest null worth reporting, E not reliable as it stands. Excludes a measure of how large or how true an effect is. full definition B* places this as a strong signal worth expanding. Three things would raise it: a second rated corpus, a listening test that changes the tail with instrumentation held fixed, and ratings of felt calm.
Limitations
- Tail length is partly a proxy for instrumentation and production style. Timbre was not held fixed, so the sound may not cause the rating.
- DEAM ratings are crowd judgments of perceived emotion in 45-second clips. They are not felt calm, relief or any change in mood.
- Room reverberation could not be measured apart from note decay with these tools. The finding is about the combined tail.
- The audio came from a public mirror whose file count matches the published set but which has no official checksum.
- The instrument check used one family of synthetic music. Real mixes can behave differently.
- The genre and note-rate checks were run after the verdicts.
- A later review of dose-response shapes across our findings fitted two lines to this relation and read it as a fall that levels off, with no U shape (quadratic term p 0.012). That review is cited from our ledger and was not re-run for this paper.
- Scoring was done by our own code and was not blind. The ratings come from DEAM's raters and stand apart from the code.
Evidence
Held. Real recordings, artist-held-out test and working shuffle, with a reversed valence forecast kept. Spectrum-affect links are known, and tail is not separated from instrument or from room reverb.
Figures
These are the paper's own figures, numbered as in the PDF, and each "Figure" reference in the text points here. The charts on this page redraw the same results from the result files and carry their own numbers.
Tables
| Control | Mean | 5th pct | 95th pct | Real value |
|---|---|---|---|---|
| Calm index shuffled, arousal | 0.000 | -0.076 | 0.074 | -0.394 |
| Calm index shuffled, valence | -0.002 | -0.078 | 0.077 | -0.375 |
| Tail and slope shuffled, R2 gain | -0.001 | -0.008 | 0.003 | 0.110 |
| Test | Value | 95% interval | Verdict |
|---|---|---|---|
| P1 calm index, arousal | -0.394 | -0.476 to -0.304 | pass |
| P2a tail, arousal | -0.301 | -0.386 to -0.200 | pass |
| P2b spectral slope, arousal | 0.324 | 0.217 to 0.426 | pass |
| P3 calm index, valence | -0.375 | -0.455 to -0.280 | fail |
| P4 R2 gain, arousal | 0.110 | 0.034 to 0.182 | pass |
| P5 P1 with tempo and entropy held | -0.343 | -0.428 to -0.246 | pass |
Appendix A. The preregistered verdicts
Each verdict is a set of rules written before the run. A verdict passes only when every rule holds. Values are read from the run's result file.
| Verdict | Deciding rules | Value | Holds |
|---|---|---|---|
| Instrument | tail strong; slope strong; constant estimator fails | yes; yes; yes | yes |
| P1 | r below 0; interval upper end below 0; r below shuffle 5th percentile (-0.076) | -0.394; -0.304 | yes |
| P2a | r below 0; interval upper end below 0 | -0.301; -0.200 | yes |
| P2b | r above 0; interval lower end above 0 | 0.324; 0.217 | yes |
| P3 | r above 0; interval lower end above 0; r above shuffle 95th percentile (0.077) | -0.375; -0.455 | no |
| P4 | gain above 0; interval lower end above 0; gain above shuffle 95th percentile (0.003) | 0.110; 0.034 | yes |
| P5 | r below 0; interval upper end below 0 | -0.343; -0.246 | yes |
Numbers recorded in our publication register
| What | Value |
|---|---|
| Sample | 502 test clips by 270 artists, from 1,744 rated clips |
| Main estimate and interval | partial r -0.394 (-0.476 to -0.304); valence -0.375 (-0.455 to -0.280); gain in explained variance +0.110 (0.034 to 0.182) |
| Forecast against outcome | The arousal forecasts passed. The valence forecast expected a rise and valence fell. Two further forecasts on listeners' personality were not blind, and the paper leaves them out |
| Known-answer check | synthetic music recovery, error ratios 0.12 and 0.21 |
As recorded in the publication register, the summary row each finding gets; the paper's own numbers above were re-read from the result files.
What lowers it
- blinding Not blind. The ratings come from DEAM's crowd raters and stand apart from our code; a personality part of the study was not blind. from our publication register, on blinding
- failed check Controls: working: the 5th percentile of the permuted calm index was -0.076; the instrument check on synthetic music passed; a check on reverb size failed in dense music. from our publication register, on controls
- novelty Nearby work exists; novelty is not shown. from our publication register, on the literature
- depth of reading The cited literature was read at the level of abstracts, repository records and publisher pages; full texts were not read. from the Verified section
What holds it up
- scoring Scored by code against rules fixed in advance. from our publication register, on who scored it
- preregistration Preregistered and hash-locked before the run (sha256 ae20eac8). from the Reproduce section
- open data Public data. from our publication register, on the data licence
Where the claim stands
- lead
- hypothesis
- thesis
- conjecture
- theorem
- law candidate
- killed
A preregistration with pass-or-fail rules is on file, which this rung needs. The next rung needs a named rival reading beaten by a decisive observation, and none is on file. Tier B*: Real recordings, artist-held-out test and working shuffle, with a reversed valence forecast kept. Spectrum-affect links are known, and tail is not separated from instrument or from room reverb.
Trail
Versions
- v3 2026-11-14, this page corrected, 2 items; the PDF and its BuildTeX source are still paper version 1.0
- v2 2026-11-09, paper version 1.0, first published PDF sha256 ba17e291945c97d4
- v1 2026-10-29, entered in the findings ledger
Corrections
2026-11-14 wording found by a review of the published pages
A review of the published page found two words that go past the ratings. now The title and the reader section said sadder; the ratings measure valence, how pleasant a clip is judged to be, and name no emotion, so both now say less pleasant. The reader section and the discussion said these properties will move music toward calm; timbre was not held fixed and no clip was altered, so the text now reports the association and says a causal test is still needed.
2026-11-14 scope found by a review of the published pages
A review of the published page found a clip count that did not match the post hoc file. now The per-genre result was described as covering all 1,744 clips; the 11 genres hold 1,743, and the one clip tagged Other is left out. The text and the figure caption now say 1,743.
2026-11-09 scope found by the publication pass
The two questionnaire tests in the same preregistration are left out because they were not blind.
2026-10-29 wording found by a later study of ours
A later review of dose-response shapes in our ledger read the arousal relation as a fall that levels off. now This paper states it in the limitations.
2026-10-29 wording found by the study itself, before publication
The audio loader's resampler changed after the lock and before feature extraction, recorded at the time; the instrument check does not pass through the loader.
Standing, and the ledger entries it rests on
2026-10-29 narrowed in part F49
Set by hand from findings ledger entry F49, dated 2026-10-29: shape of the arousal relation. Rests on findings ledger, F49.
Each correction is a dated note; the findings ledger is never rewritten, and a note governs where it differs.
Ledger and version dates up to publication are local dates in US Pacific time. Clock times in the text are UTC, seven or eight hours ahead, so a lock or a run stamped just after midnight UTC belongs to the previous local day. Corrections from 14 November 2026 on are dated in UTC.
References
- Aljanaki, A., Yang, Y.-H. and Soleymani, M. (2017). Developing a benchmark for emotional analysis of music. PLoS ONE 12(3), e0173392. doi:10.1371/journal.pone.0173392 run here Licence: research-only: DEAM CC BY-NC; audio from a Hugging Face mirror, official host unreachable used in Introduction and motivation, Data and provenance
- Eerola, T., Ferrer Flores, R. and Alluri, V. (2012). Timbre and affect dimensions: evidence from affect and similarity ratings and acoustic correlates of isolated instrument sounds. Music Perception 30(1), 49-70. doi:10.1525/mp.2012.30.1.49 abstract or summary, 2026-11-09: abstracts, repository records and publisher pages; full text not read used in Introduction and motivation, Discussion
- Korsmit, I. R., Montrey, M., Wong-Min, A. Y. T. and McAdams, S. (2024). The acoustic properties of affective timbres: consistencies and discrepancies in a synthesis of multiple datasets. Music and Science. doi:10.1177/20592043241256012 abstract or summary, 2026-11-09: abstracts, repository records and publisher pages; full text not read used in Introduction and motivation, Discussion
- Mo, R., Wu, B. and Horner, A. (2015). The effects of reverberation on the emotional characteristics of musical instruments. Journal of the Audio Engineering Society 63(12), 966-979. doi:10.17743/jaes.2015.0082 abstract or summary, 2026-11-09: abstracts, repository records and publisher pages; full text not read used in Introduction and motivation, Discussion
- Wilkie, H. and Harrison, P. M. C. (2025). Reverberation time and musical emotion in recorded music listening. Music Perception 42(4), 329-355. abstract or summary, 2026-11-09: abstracts, repository records and publisher pages; full text not read used in Introduction and motivation, Discussion
Cited by later findings
- F49 narrowed in part, shape of the arousal relation, 2026-10-29 (record findings ledger, F49). The two-lines test rejects a U for calm against arousal: the quadratic term is significant (p 0.012) and the relation is a fall that levels off.
Reproduce
Data
- Aljanaki 2017. Licence: research-only: DEAM CC BY-NC; audio from a Hugging Face mirror, official host unreachable. https://doi.org/10.1371/journal.pone.0173392
Preregistration
sha256 ae20eac8980611bc07f8e082e3f07c636229179a7ee051c7305b7423e32b89c7
plan b051a324f52e1dda7802c57aa3a0d6e33ca3f4db0b51b750e810360df73fefc6
Steps
- Data: DEAM [1], the 45-second clips with static per-clip arousal and valence means, and the dataset's metadata for artist and genre. Licence CC BY-NC.
- Convert each clip to mono at 22,050 Hz and keep the first 45 seconds. Measure the tail, eq. 1, and the spectral slope; check both on synthetic music with planted decay and tilt first.
- Hold out 30 percent of artists. Build the calm index, eq. 2, with training-set scaling. Compute partial correlations, eq. 3, with loudness, genre and year as controls, and the held-out R2 gain, eqs. 4 and 5. Use 2,000 artist-bootstrap resamples for intervals and 1,000 shuffles for each control.
- Preregistration SHA-256: ae20eac8980611bc07f8e082e3f07c636229179a7ee051c7305b7423e32b89c7. Plan SHA-256: b051a324f52e1dda7802c57aa3a0d6e33ca3f4db0b51b750e810360df73fefc6. Run 20261029T162517Z.
Cost. The scored analysis and its controls took under a minute on one desktop computer. Feature extraction time was not recorded. The data used about 2.6 GB of disk with the audio unpacked. The study was not re-run for this paper.
Downloads
- Whitepaper, PDF F39.pdf, 584 KB
- BuildTeX source F39.bld, 33 KB
- Build receipt F39.buildtex.json, 1 KB
- BuildLang doc module doc.bld, 5 KB, imported by the source
The PDF is typeset by BuildTeX from F39.bld, which is written from the same source as this page. The receipt records the source's SHA-256 and the PDF's (ba17e291945c), so anyone can rebuild it and compare. The copy here has its hidden author field blanked, as the site does for every file it publishes; blank the same field in a rebuild before comparing. The name stays on the first page.
Verified
Verified on 2026-11-09. On 9 November 2026 the counts (1,744 clips, 502 test clips, 270 test artists, 1,242 training clips), the partial correlations -0.394, -0.301, +0.324, -0.375 and -0.343 with their intervals, the R2 gain 0.110 and its interval, the controls-only R2 0.160, all three shuffle controls, the whole-sample values and every verdict were re-read from the run's result file. The post hoc values (-0.227, -0.370, -0.285, -0.324, 0.54, note rate and the 11 genre values) were re-read from the post hoc file, and the instrument ratios and rank correlations from the instrument file. These match the findings ledger. The preregistration's SHA-256 matches the hash recorded in the result file. All three figures were drawn by a script that reads only those three files.
Not checked. The study was not re-run for this paper. The literature was found by searches run on 9 November 2026 and read at the level of abstracts, repository records and publisher pages; the full texts were not read.
Terms on this page
Each term is defined where it is first used on this page. Each name below opens its entry in the findings glossary, which lists every page that uses it.
- preregistration research method (metascience) first use
- verdict research method (our usage) first use
- arousal and valence psychology of emotion (the circumplex model) first use
- perceived emotion music psychology first use
- onset-locked tail audio signal processing (our measure) first use
- spectral slope audio signal processing first use
- held-out test set statistics and machine learning first use
- partial correlation statistics first use
- held-out R2 gain statistics first use
- 95% interval statistics first use
- cluster bootstrap statistics first use
- planted check research method; called a positive control in experimental science first use
- control statistics and experimental design first use
- null distribution statistics first use
- honest null research method (our usage) first use
- tier our publication register first use
To report an error, name the finding, the claim number and the source on the Work page, which gives the address. Accepted corrections join the Trail with their date.