
Findings F362 Instruments and control, Physics, Computing and mathematics, Method and statistics found 2026-10-31
Published 1 sigma error bars hold near nominal; a 95 percent interval needs 3 to 5 sigma
When a particle mass or an atomic mass moves between editions of its reference table, the old 1 sigma error bar covers the new value about as often as it should (0.68 and 0.66). The tails are far heavier than a bell curve, so covering 95 percent of later values took 3 to 5 times the stated sigma in these tables. Six of our ten forecasts held; we expected error bars to cover too rarely, and counted over all values they covered 0.79.
- Tier
- B, signal
- Outcome
- held
- Rung
- hypothesis
- Verdicts
- 8 passed, 5 failed
- Kill rule
- not fired
- Corrections
- 3, latest 2026-11-14
- Version
- v3, 2026-11-14
- Redo it
- Reproduce
Download PDF 3.6 MB BuildTeX source F362.bld
What this means for a reader
When a table prints a value plus or minus one sigma, the next edition usually lands about as close as that promise says. Large misses are the problem: shifts of four or five sigma happen far more often than a bell curve allows. If you need 95 percent confidence from a published plus-or-minus, multiply it by three to five, and by more for an astronomical quantity that is still being settled. That multiple describes how these tables behaved in the past, and it will miss when an input shared by many values turns out wrong.
Objection
Later tables reuse inputs from earlier ones (shared inputs), so the later edition is not independent of the earlier one. That flatters every coverage figure here. Editions that share no inputs would be the cleaner test.
What would change the call. Our publication register records no condition that would raise or overturn this call.
From the paper's first stated limitation; our register records no separate objection.
Abstract
A stated uncertainty is a forecast of where later, better measurements will put a value. We scored that forecast on four reference sources: particle masses and widths in the Particle Data Group tables (2010 to 2025), atomic masses in the Atomic Mass Evaluation (2003 to 2020), the CODATA recommended constants (2002 to 2022) and Huchra's compilation of published Hubble constant values. For each quantity we measured the shift between the first and last edition in units of the first edition's stated sigma. The earlier 1 sigma interval covered 0.68 of later PDG values that moved (n 227) and 0.66 of later AME values (n 2,213, nearly all of which moved), close to the nominal 0.6827. The tails are far heavier than a normal curve. Covering 95.45 percent of later values took 3.8 times the stated sigma for moved PDG values, 4.0 for AME and 4.9 for CODATA. Student t fits to the nonzero shifts gave nu of 1.67 for PDG, 1.22 for AME and 2.17 for CODATA, close to the Cauchy shape. Published Hubble constant values before 1990 covered a proxy truth of 70 km/s/Mpc within 1 sigma in 0.35 of 115 cases. Later tables reuse inputs from earlier ones, which flatters every coverage figure here.
c1 observed, evidence for claim 1
- The numbers in claim 1
- 1; 0.68; 227; 0.66; 2,213; 0.6827 matches the result file, 2026-11-09
- Chart 1
- How an old stated uncertainty is scored against the value printed later.
- Chart 3
- How often the earlier stated interval held the later value.
- Basis
- observed: measured in this study, with a result file
c2 observed, evidence for claim 2
- The numbers in claim 2
- 95.45; 3.8; 4.0; 4.9 matches the result file, 2026-11-09
- Chart 1
- How an old stated uncertainty is scored against the value printed later.
- Chart 4
- How many stated sigma it takes to cover 95.45 percent of later values.
- Basis
- observed: measured in this study, with a result file
c3 observed, evidence for claim 3
- The numbers in claim 3
- 1.67; 1.22; 2.17 matches the result file, 2026-11-09
- Chart 5
- The tail shape of the shifts, as a fitted Student t.
- Basis
- observed: measured in this study, with a result file
c4 observed, evidence for claim 4
- The numbers in claim 4
- 1990; 70; 1; 0.35; 115 matches the result file, 2026-11-09
- Chart 3
- How often the earlier stated interval held the later value.
- Basis
- observed: measured in this study, with a result file
Introduction
A stated 1 sigma uncertaintyDefinition: stated 1 sigma uncertainty metrology (the standard uncertainty of the GUM) and physics data tables The plus-or-minus a table prints beside a value, meant as one standard deviation of the value's error. For a normal error the interval of one sigma either side holds the truth 68.27 percent of the time and two sigma 95.45 percent. Excludes an expanded uncertainty already multiplied by a coverage factor, and any bound meant to hold always. full definition is the plus-or-minus a table prints beside a value, meant as one standard deviation of its error. For a normal error, one sigma either side should hold the truth 68.27 percent of the time and two sigma 95.45 percent. Later editions of the same table give a better estimate of the true value, so the share of later values that fall inside an earlier interval, its coverageDefinition: coverage statistics and metrology The share of cases in which an interval drawn round an earlier value contains the value that later replaced it. Here the interval is one or two of the earlier value's own stated sigma either side. Excludes the share of intervals that contain the true value, which no later table can supply. full definition, can be counted.
Henrion and Fischhoff [5] examined the history of the physical constants, including the speed of light, and found that reported uncertainties were consistently too small, with recommended values often moving by more than their stated errors. Chen, Gott and Ratra [6] built the error distribution of 461 Hubble constant measurements in Huchra's compilation against a central value of 71 km/s/Mpc. They found it non-Gaussian, with 95.4 percent limits at 7.0 times the quoted errors and a shape described by a widened Student t with two degrees of freedom. Bailey [7] analysed about 41,000 measurements of 3,200 quantities from medicine, nuclear and particle physics and interlaboratory comparisons, and found the normalised differences between measurements of the same quantity close to Student t distributions, often almost Cauchy. Its reading is that researchers estimate the size of typical errors well and underestimate the chance of large ones.
This paper asks the same question of edition-to-edition changes in four large tables at once, with a planted check, a normal-world control, a test that removes unchanged values, and forecasts fixed in advance. Bailey's data include nuclear and particle physics. Our searches on 9 November 2026 did not return a study that scores the PDG mass-width files edition against edition; that is what the searches returned, and it does not show that none exists.
Preregistration and design
The design was written as a preregistrationDefinition: preregistration research method (metascience) A dated written plan for a study, fixed and hash-locked before any result is seen: the question, the data, the statistic, the controls, the forecasts and the kill conditions. Excludes a plan revised after looking at the outcome, and a protocol written only for the record after the run. full definition dated 31 October 2026 and hash-locked on 1 November 2026 at 01:54 UTC. The forecasts were copied from an earlier forecast file written and hashed before any data were read. Before the lock, the file formats of the PDG, AME and Huchra tables were read; no coverage was computed. The decision it informs was stated in the file: whether stated uncertainties, and our own forecast bands, get a correction factor.
The locked file names the tables and editions, the coverage count, a moved-values armDefinition: moved-values arm research method, our usage The same coverage count repeated after dropping every quantity whose value did not change between the two editions, since an unchanged value counts as covered whatever its stated uncertainty. Excludes a test of whether the unchanged values were right. full definition that drops every quantity whose value did not change (an unchanged value counts as covered whatever its sigma), the proxy truthDefinition: proxy truth research method, our usage A value fixed in advance and used in place of the unknown true value where no later edition settles it. Here three values of the Hubble constant, 67.4, 70 and 73 km/s/Mpc, each reported on its own. Excludes a claim that any of the three is the true value. full definition values for the Hubble constant, a planted checkDefinition: planted check research method; called a positive control in experimental science Data built so that the right answer is known, run through the same analysis before the real data, to show that the analysis can see the effect when it is there. Excludes any check made on the real data, which cannot show what the analysis misses. full definition (data built so the right answer is known, run through the same analysis), a controlDefinition: control statistics and experimental design A version of the data with the structure under test removed (for example shuffled or pooled), scored the same way as the real data, so the real score has something to beat. Excludes a comparison with a different dataset or with a published number. full definition (a version of the data with the structure under test removed, scored the same way), the assumptions to be changed one at a time, the forecasts and a kill conditionDefinition: kill condition research method (our usage, after Popper's falsification) A rule written in the preregistration that, when met, decides against the claim with no room for judgement after the run. Excludes reasons found after the run for setting a result aside. full definition, a rule that decides against the claim with no room for judgement after the run.
Kill condition, without discretion: if the planted check fails, no coverage claim counts.
The same run also scored our own numeric forecast bands from earlier studies. That arm is reported as a separate finding (F366) and appears here only in the appendix.
Data and provenance
- Particle Data Group, Review of Particle Physics, mass and width files for Monte Carlo programs, editions 2010, 2012, 2014, 2016, 2018, 2020, 2022, 2024 and 2025 [1]. Recent editions are released under CC BY 4.0; the terms for older editions were not read. Asymmetric errors were averaged into one sigma.
- Atomic Mass Evaluation, editions 2003, 2012, 2016 and 2020 [2]. The 2016 and 2020 files came from the IAEA Atomic Mass Data Center; the 2003 and 2012 files were refused by the live server and taken from Internet Archive copies of the same addresses. No licence was stated on the pages read. Values marked as estimated were removed.
- CODATA recommended values of the fundamental constants, 2002 to 2022, from the NIST archive of ASCII tables [3]. Values with zero stated uncertainty (exact values) do not enter as earlier values.
- Huchra's table of published Hubble constant estimates, last updated 7 October 2010 [4], from an Internet Archive copy of 2012. No licence was stated. Asymmetric errors were averaged.
All four are public tables of measured values. The files were read as data. If the PDG 2016 file had been identical to 2014 it would have been dropped; it was not.
Methods
Shift in units of the earlier sigma
- dataTables of record, several editionsPDG particle properties 2010 to 2025, AME atomic masses 2003 to 2020, CODATA constants 2002 to 2022, and 544 published Hubble constant values.
- measurementShift in units of the old sigmaThe later value minus the earlier value, divided by the earlier sigma (the stated standard uncertainty printed beside a value).
- measurementCoverage and needed multipleCoverage is the share of shifts inside 1 or 2 sigma. A normal error gives 0.6827 and 0.9545. The needed multiple is how many sigma it takes to reach those shares.
- planted checkPlanted: recovered 2.405A made-up world with stated errors at half the true error. The true multiple is 2.394.
- controlControl: honest normal worldStandard normal shifts at the PDG sample size, 500 draws. Shortfall from 0.6827: mean 0.0005, 95th percentile 0.040.
- heavy tails3.8 to 4.9 sigma for 95.45 percent1 sigma coverage: PDG 0.68, AME 0.66. The stated sigma is about right in the middle and too small in the tails.
Read from result.json, run 20261101T015415Z. SHA-256 of the run's file 808cc6bdfb4881a9ef594399a848dc0cde0ecacfd73497e0e5f42b70524c613d and of the published copy cfde632652cb4cbc6056bb31340f96ee23a7cbbbfefdec2fe4e854fbe22ec5cd. In the copy, file paths are cut to the file name and the layout (indentation, line endings) may differ; every value is the same.
For quantity with value and stated sigma in the first edition and value in the last, the shift in units of the earlier sigmaDefinition: shift in units of the earlier sigma statistics, our usage; called a normalised residual in metrology The size of the change in a quantity's value between an earlier and a later edition of a table, divided by the uncertainty stated in the earlier edition. Excludes the sign of the change, and any uncertainty in the later value. full definition is
Only quantities present in both editions with enter.
Coverage and needed multiple
Coverage at sigma is the share of quantities with :
where counts the quantities whose shift is at most and is the number of quantities. The needed multipleDefinition: needed multiple metrology, our usage; a coverage factor fitted after the fact The multiple of the stated sigma that would have covered 68.27 or 95.45 percent of the later values. It is the matching percentile of the shifts in units of the earlier sigma, written k68 and k95. Excludes a factor known before the later values were published. full definition is the 68.27th percentile of the shifts and the 95.45th percentile: the multiples of the stated sigma that would have covered those shares. For honest normal errors both coverages sit at 0.6827 and 0.9545 and the two multiples at 1 and 2.
Tail shape
A folded Student t distributionDefinition: Student t distribution and its tail index nu statistics A bell-shaped family with heavier tails than the normal curve. Its degrees of freedom nu set the tail weight, so small nu means large shifts are common, nu of 1 is the Cauchy distribution and nu without limit is the normal curve. Excludes skewed or bounded shapes. full definition with a scale and degrees of freedom nu was fitted by maximum likelihood to the nonzero shifts. Small nu means heavy tails; nu of 1 is the Cauchy distributionDefinition: Cauchy distribution probability The Student t distribution with nu equal to 1, whose tails are so heavy that its mean and variance do not exist. Excludes any distribution with a finite variance. full definition, and a normal curve has nu without limit.
Intervals
The interval on each 1 sigma coverage comes from a bootstrapDefinition: bootstrap statistics, resampling Redrawing the quantities of a table with replacement, here 300 times, and recomputing the coverage each time. The middle 95 percent of the recomputed values is the interval. Excludes uncertainty from the choice of editions or from shared inputs, which resampling quantities does not touch. full definition: quantities are redrawn with replacement 300 times and the coverage recomputed; the 95% intervalDefinition: 95% interval statistics The range that holds the middle 95 percent of the bootstrap or control draws for a number. We report it beside the number. Excludes a statement that the true value lies inside with 95 percent probability. full definition is the middle 95 percent of the redrawn values.
The Hubble constant
Huchra's table has no later edition of each entry. Each published value was scored against a proxy truth fixed in advance, 67.4, 70 or 73 km/s/Mpc, reported separately, and the values published before 1990 were scored against 70.
Changes of assumption
Each was run apart: the moved-values arm; the top 1 percent of shifts removed; the last pair of editions alone; and, for CODATA, one row per distinct shift rounded to two decimals, since many constants are derived from the same inputs. A shrink test asked, for each quantity in three or more editions, whether its stated error fell faster than its edition-to-edition steps. An out-of-sample test fitted the needed multiples on the earlier half of the editions and applied them to the later half.
Controls and planted checks
The planted check built 4,000 shifts in a world where the stated sigma is half the true error and the errors follow a Student t with three degrees of freedom. The true is
where is the 0.84135 quantile of that t distribution. On a planted world with stated errors set to half the true error, the method recovered the needed multiple as 2.405 against a true 2.394. The fitted nu was 3.002 against a true 3. The kill condition did not fire.
c5 observed, evidence for claim 5
- The numbers in claim 5
- 2.405; 2.394 matches the result file, 2026-11-09
- Chart 2
- Does the method recover a multiple that was planted on purpose?
- Basis
- observed: measured in this study, with a result file
The honest normal worldDefinition: honest normal world statistics, our control Simulated shifts drawn from a standard normal distribution at the PDG sample size, so that every stated sigma is exactly right, scored the same way as the real shifts. Excludes heavy tails and shared inputs. full definition draws standard normal shifts at the PDG sample size (347) and scores the same shortfall
Over 500 draws the shortfall had mean 0.0005 and 95th percentile 0.040, the top of its null distributionDefinition: null distribution statistics The spread of scores a control gives over many random draws. Its 95th percentile is the bar a real score must clear. Excludes a theoretical distribution assumed rather than drawn from the data. full definition. The real PDG shortfall over all values was -0.110: the PDG tables over-cover, so the preregistered hypothesis that their shortfall exceeds chance failed (p from drawsDefinition: p value (from draws) statistics The share of control draws scoring at or above the real score, with one added to the count and to the number of draws, so it is never zero. Excludes a p value from a textbook formula that assumes a distribution. full definition 1.0).
Results
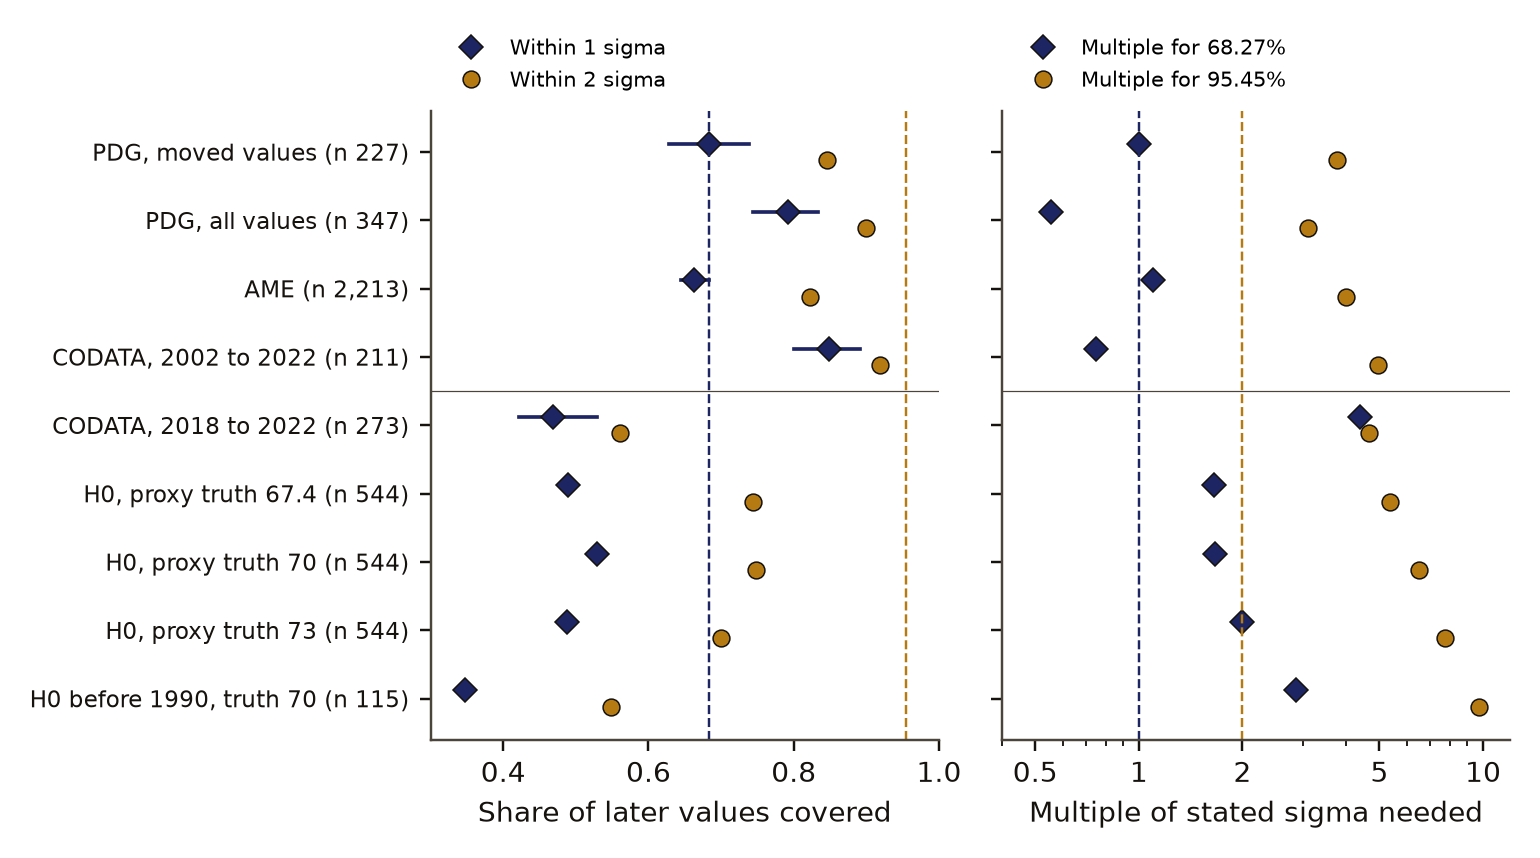
Table 1 gives every field and Figure 2 draws the same numbers. The earlier 1 sigma interval covered 0.68 of later PDG values that moved (n 227) and 0.66 of later AME values (n 2,213, nearly all of which moved), close to the nominal 0.6827. The 95% intervals on those two coverages are 0.63 to 0.74 for PDG and 0.65 to 0.68 for AME; only 0.3 percent of the AME values did not move. At 2 sigma both fall short of 0.9545, at 0.85 and 0.82.
share of later values inside the earlier interval
- inside 1 sigma
- inside 2 sigma
- 95 percent bootstrap interval, drawn at 1 sigma for the three tables. The result file holds none at 2 sigma or for the Hubble values.
- nominal at 1 sigma, 0.6827
- nominal at 2 sigma, 0.9545
Data behind chart 3 5 rows
| Source | Editions or truth | n | Inside 1 sigma | 95 percent interval | Inside 2 sigma | Share that did not move |
|---|---|---|---|---|---|---|
| PDG particle values that moved | 2010 to 2025 | 227 | 0.683 | 0.628 to 0.738 | 0.846 | 0.000 |
| AME atomic masses | 2003 to 2020 | 2,213 | 0.663 | 0.645 to 0.684 | 0.822 | 0.003 |
| CODATA constants | 2002 to 2022 | 211 | 0.848 | 0.801 to 0.891 | 0.919 | 0.000 |
| Hubble constant values before 1990 | against a proxy truth of 70 km/s/Mpc | 115 | 0.348 | not in the file | 0.548 | 0.026 |
| PDG, all values | 2010 to 2025 | 347 | 0.793 | 0.744 to 0.833 | 0.899 | 0.346 |
Read from result.json, run 20261101T015415Z. SHA-256 of the run's file 808cc6bdfb4881a9ef594399a848dc0cde0ecacfd73497e0e5f42b70524c613d and of the published copy cfde632652cb4cbc6056bb31340f96ee23a7cbbbfefdec2fe4e854fbe22ec5cd. In the copy, file paths are cut to the file name and the layout (indentation, line endings) may differ; every value is the same.
Covering 95.45 percent of later values took 3.8 times the stated sigma for moved PDG values, 4.0 for AME and 4.9 for CODATA. Student t fits to the nonzero shifts gave nu of 1.67 for PDG, 1.22 for AME and 2.17 for CODATA, close to the Cauchy shape.
Over all PDG values, including the 0.35 that never moved, the tables over-cover at 1 sigma (0.79). In the last PDG step, 2024 to 2025, 0.96 of 421 values did not move. Coverage that counts those values says more about which values were carried forward than about how honest the stated errors are.
The CODATA step from 2018 to 2022 covered only 0.47 at 1 sigma. A later reading of this run, made after the lock and recorded as a separate finding, traced most of that step to one input: 99 of the 273 rows moved by 4.2 to 4.7 of their 2018 sigma when the fine-structure constant moved by 4.55 of its own. The CODATA 2022 adjustment reports that move; we did not re-read the report for this paper. The rows are not independent: kept to one row per distinct shift, CODATA has 76 rows, with 1 sigma coverage 0.63 and 5.1.
Published Hubble constant values before 1990 covered a proxy truth of 70 km/s/Mpc within 1 sigma in 0.35 of 115 cases. Over all 544 values the needed was 5.4 to 7.7 depending on the proxy, the worst field in the set at every proxy. Ten published speed-of-light values from before 1983, scored against the defined value, covered 0.5 at 1 sigma; six of those came from fetched sources and the rest were transcribed, so we give that row no weight.
Removing the top 1 percent of shifts changed 1 sigma coverage by about 0.01 (PDG 0.80, AME 0.67, CODATA 0.86) and lowered to 2.8 for PDG, 3.6 for AME and 3.2 for CODATA. The largest single shift, the alpha particle molar mass in CODATA at 74 sigma, comes from the 2019 redefinition of the SI changing the molar mass rows. The largest PDG shift (12.7) and the largest AME shift (silicon-32, 64) were not traced.
Needed multiples did not carry forward in time where values moved. Fitted on CODATA 2002 to 2014 and applied to 2014 to 2022, of 0.65 lowered 1 sigma coverage from 0.40 to 0.32, and of 1.46 reached 0.79 where 0.9545 was the aim. In AME, 2016 to 2020 hardly moved, and coverage stayed at 0.94.
The shrink test found stated errors falling faster than the steps between editions in 0.66 of 287 CODATA quantities, 0.52 of 104 PDG quantities and 0.25 of 2,227 AME quantities. No general rule that uncertainty shrinks faster than values settle follows from that.
Table 2 sets the forecasts against the outcomes. Of the ten forecast verdicts in the result file, six held.
Discussion
The pattern matches Bailey [7]: the core of a stated uncertainty is about right and the tails are not. Our fitted nu values, 1.2 to 2.2, sit at or below the heavy end of what that paper describes, and nearer the Cauchy shape. Our Hubble constant result agrees with Chen, Gott and Ratra [6] in kind: they put 95.4 percent limits at 7.0 times the quoted errors against a central value of 71, and we find 6.5 against 70 on a larger version of the same compilation.
In these tables the fault sits in the tails. Bailey draws the same distinction: underestimating every sigma by one factor widens a normal curve without giving it heavy tails. In our tables, the 1 sigma multiple sits near 1 while the 95.45 percent multiple sits near 4. A single scaling of every error bar cannot fix both.
The CODATA step from 2018 to 2022 shows how the tails arise in a table built from shared inputs: one input moves and carries many derived values with it. Henrion and Fischhoff [5] found the reported uncertainties of the constants too small across their history. A correction factor fitted on quiet years will miss the next one, which is what the out-of-sample test found.
Limitations
- Later tables reuse inputs from earlier ones (shared inputsDefinition: shared inputs metrology and data evaluation Measurements or derived values that feed both an earlier and a later edition of a table, so that the two editions are not independent and agree more than independent work would. Excludes measurements made only for the later edition. full definition), so the later edition is not independent of the earlier one. That flatters every coverage figure here. Editions that share no inputs would be the cleaner test.
- The Hubble constant numbers depend on the proxy truth chosen. Read them per proxy.
- PDG editions before 2010 could not be reached. The older AME files came through the Internet Archive and their terms were not read.
- An unchanged value counts as covered. The moved-values arm removes those values but keeps quantities whose change was small for reasons of bookkeeping.
- Needed multiples fitted on early CODATA editions did not carry forward. The 3 to 5 sigma figure describes the past and will miss when a shared input breaks.
- Our forecast of 0.55 for PDG coverage over all values missed at 0.79, because 0.35 of those values never moved.
- Scoring was by our own code and was not blind.
Evidence
Held. Real public tables with planted and honest controls, and a clear statement of correlated inputs.
Figures
These are the paper's own figures, numbered as in the PDF, and each "Figure" reference in the text points here. The charts on this page redraw the same results from the result files and carry their own numbers.
Tables
| Table | Editions | n | Within 1 sigma | Within 2 sigma | k68 | k95 | nu |
|---|---|---|---|---|---|---|---|
| PDG, moved values | 2010 to 2025 | 227 | 0.68 | 0.85 | 1.00 | 3.8 | 1.67 |
| PDG, all values | 2010 to 2025 | 347 | 0.79 | 0.90 | 0.56 | 3.1 | not fitted |
| AME | 2003 to 2020 | 2,213 | 0.66 | 0.82 | 1.10 | 4.0 | 1.22 |
| CODATA | 2002 to 2022 | 211 | 0.85 | 0.92 | 0.75 | 4.9 | 2.17 |
| CODATA, last step | 2018 to 2022 | 273 | 0.47 | 0.56 | 4.4 | 4.7 | not fitted |
| Hubble constant, truth 67.4 | to 2010 | 544 | 0.49 | 0.74 | 1.66 | 5.4 | not fitted |
| Hubble constant, truth 70 | to 2010 | 544 | 0.53 | 0.75 | 1.67 | 6.5 | not fitted |
| Hubble constant, truth 73 | to 2010 | 544 | 0.49 | 0.70 | 2.0 | 7.7 | not fitted |
| Hubble constant before 1990, truth 70 | before 1990 | 115 | 0.35 | 0.55 | 2.9 | 9.8 | not fitted |
| Quantity | Forecast (band) | Outcome |
|---|---|---|
| PDG, all values, within 1 sigma | 0.55 (0.40 to 0.68) | 0.79 |
| PDG, all values, within 2 sigma | 0.80 (0.65 to 0.92) | 0.90 |
| PDG, k68 | 1.5 (1.2 to 2.2) | 0.56 |
| PDG, k95 | 2.5 (1.5 to 5) | 3.1 |
| PDG, nu | 3 (1.5 to 6) | 1.67 |
| CODATA 2002 to 2022, within 1 sigma | 0.35 to 0.70 | 0.85 |
| PDG moved values below all values | yes | 0.68 against 0.79 |
| CODATA errors fall faster than steps | in more than half | 0.66 |
Appendix A. The preregistered verdicts
Each verdictDefinition: verdict research method (our usage) The pass or fail of one preregistered rule set against the run's numbers, read off by code. Excludes an interpretation written after reading the numbers. full definition is a set of rules written before the run, read off by code. A verdict passes only when every rule holds. Values are read from the run's result file. The last three rows belong to the arm on our own forecast bands, reported as a separate finding.
| Verdict | Deciding rule | Value | Holds |
|---|---|---|---|
| Kill not fired | planted multiple within 0.15 of truth (relative); planted own-band check within 0.15; at least 50 own bands | 0.004; 0; 175 | yes |
| PDG within 1 sigma | all values, between 0.40 and 0.68 | 0.79 | no |
| PDG within 2 sigma | all values, between 0.65 and 0.92 | 0.90 | yes |
| PDG k68 | between 1.2 and 2.2 | 0.56 | no |
| PDG k95 | between 1.5 and 5 | 3.1 | yes |
| PDG nu | between 1.5 and 6 | 1.67 | yes |
| CODATA within 1 sigma | between 0.35 and 0.70 | 0.85 | no |
| Moved below all | PDG moved coverage below all-values coverage (0.79) | 0.68 | yes |
| CODATA shrink | errors fall faster than steps in more than half | 0.66 | yes |
| PDG shortfall | shortfall above the honest normal world's 95th percentile (0.040) | -0.110 | no |
| Own bands hold | hold share between 0.40 and 0.70 | 0.65 | yes |
| Own bands factor | 80th-percentile widening between 1.5 and 5 | 1.36 | no |
| Own bands beat shuffle | hold share above the shuffled 95th percentile (0.223) | 0.65 | yes |
What lowers it
- scoring Scored by code and by the agent that ran it; self-graded. from our publication register, on who scored it
- blinding Not blind, as the paper's limitations state. from the paper's Limitations
- depth of reading The cited literature was read at the level of abstracts and search summaries; full texts were not read. from the Verified section
What holds it up
- preregistration Preregistered and hash-locked before the run (sha256 fd8fcf7a). from the Reproduce section
Where the claim stands
- lead
- hypothesis
- thesis
- conjecture
- theorem
- law candidate
- killed
A preregistration with pass-or-fail rules is on file, which this rung needs. The next rung needs a named rival reading beaten by a decisive observation, and none is on file. Tier B: Real public tables with planted and honest controls, and a clear statement of correlated inputs.
Trail
Versions
- v3 2026-11-14, this page corrected, 1 item; the PDF and its BuildTeX source are still paper version 1.0
- v2 2026-11-09, paper version 1.0, first published PDF sha256 712109ae8ebf3f48
- v1 2026-10-31, entered in the findings ledger
Corrections
2026-11-14 wording found by a review of the published pages
A review of the published page found the summary silent on the forecasts that failed. now Six of ten forecasts held; the hypothesis that stated error bars cover too rarely failed, since counted over all values they covered 0.79 against a nominal 0.68. The summary now says so, and the rule of thumb in the reader section now carries the limit the paper states for it.
2026-11-09 retraction found by the publication pass
A first publication note said the ledger's count of forecasts held could not be reproduced. now That note was wrong and was withdrawn the same day: the result file has ten forecast verdicts, and six pass (cov2, k95, nu, moved, shrink, own_hold), so 6 of 10 forecasts held, as the ledger says. Every preregistered verdict is listed in the appendix.
2026-10-31 wording found by a review of our findings ledger
A review of our ledger noted that later tables reuse inputs and that the Hubble constant truth is a proxy. now Both are stated in the limitations, and Hubble coverage is reported per proxy.
Standing, and the ledger entries it rests on
2026-10-31 narrowed in part F422
Set by hand from findings ledger entry F422, dated 2026-10-31: reused inputs and a proxy truth. Rests on findings ledger, F422 correction pass.
Each correction is a dated note; the findings ledger is never rewritten, and a note governs where it differs.
Ledger and version dates up to publication are local dates in US Pacific time. Clock times in the text are UTC, seven or eight hours ahead, so a lock or a run stamped just after midnight UTC belongs to the previous local day. Corrections from 14 November 2026 on are dated in UTC.
References
- Particle Data Group. Review of Particle Physics, mass and width tables for Monte Carlo programs, one file per edition, 2010 to 2025. https://pdg.lbl.gov. Retrieved 31 October 2026. run here Licence: as stated in the paper's data section used in Data and provenance
- Atomic Mass Data Center. Atomic Mass Evaluation mass tables, 2003, 2012, 2016 and 2020. IAEA Nuclear Data Section, https://www-nds.iaea.org/amdc/; 2003 and 2012 files from Internet Archive copies. Retrieved 31 October 2026. run here Licence: as stated in the paper's data section used in Data and provenance
- NIST. CODATA recommended values of the fundamental physical constants, archive ASCII tables, 2002 to 2022. https://physics.nist.gov/cuu/Constants/. Retrieved 31 October 2026. run here Licence: as stated in the paper's data section used in Data and provenance
- Huchra, J. Estimates of the Hubble constant, compiled table, last updated 7 October 2010. Internet Archive copy of 2012. Retrieved 31 October 2026. run here Licence: as stated in the paper's data section used in Data and provenance
- Henrion, M. and Fischhoff, B. (1986). Assessing uncertainty in physical constants. American Journal of Physics 54, 791-798. doi:10.1119/1.14447 abstract or summary, 2026-11-09: abstracts and search summaries; full text not read used in Introduction, Discussion
- Chen, G., Gott, J. R. and Ratra, B. (2003). Non-Gaussian error distribution of Hubble constant measurements. Publications of the Astronomical Society of the Pacific 115, 1269-1279. doi:10.1086/379219 abstract or summary, 2026-11-09: abstracts and search summaries; full text not read used in Introduction, Discussion
- Bailey, D. C. (2017). Not Normal: the uncertainties of scientific measurements. Royal Society Open Science 4, 160600. doi:10.1098/rsos.160600 abstract or summary, 2026-11-09: abstracts and search summaries; full text not read used in Introduction, Discussion
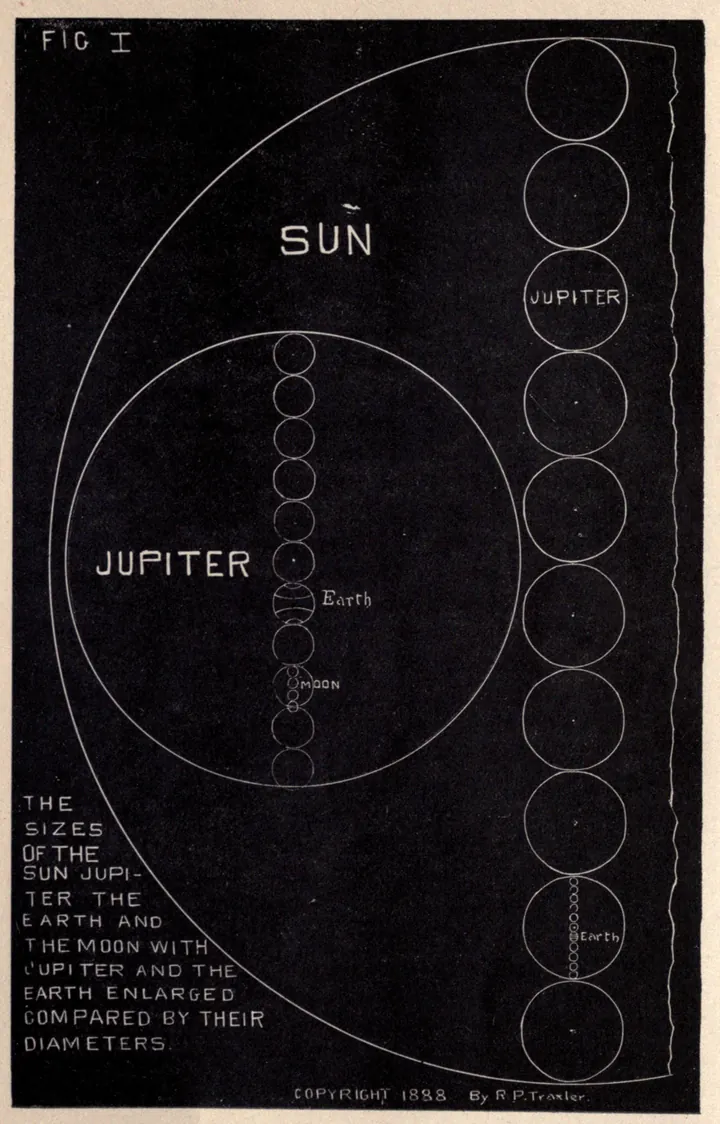
- Traxler, R. P. (1889). The Principles of Mechanics as Applied to the Solar System. San Francisco: C. A. Murdock and Co. Internet Archive item principlesofmech00traxiala. read in full: the scan, read in full on the Internet Archive used in Introduction
Cited by later findings
- F422 narrowed in part, reused inputs and a proxy truth, 2026-10-31 (record findings ledger, F422 correction pass). A later review of our ledger recorded two errors: later tables reuse inputs, and the Hubble constant truth is a proxy.
Reproduce
Data
- Particle Data Group. Licence: as stated in the paper's data section. https://pdg.lbl.gov
- Atomic Mass Data Center. Licence: as stated in the paper's data section. https://www-nds.iaea.org/amdc/
- NIST. Licence: as stated in the paper's data section. https://physics.nist.gov/cuu/Constants/
- Huchra, J. Licence: as stated in the paper's data section.
Preregistration
sha256 fd8fcf7aeea1db717bce5553792bfbc63c88d7e69ee503256ccf7fc5215e2ec1
plan adcbbf0f6bd1d24178e5ebaafcf3c7a5de1cca88489f5e5cdf7b1a754dec662c
Steps
- Data: download the PDG mass-width files for 2010 to 2025, the AME mass tables for 2003, 2012, 2016 and 2020, the NIST CODATA ASCII tables for 2002 to 2022, and Huchra's Hubble constant table.
- Match quantities between the first and last edition of each table and compute eq. 1 with the first edition's stated sigma.
- Report coverage at 1 and 2 sigma, eq. 2, the 68.27th and 95.45th percentiles of the shifts, a folded Student t fit to the nonzero shifts, and a bootstrap interval on the 1 sigma coverage.
- Repeat with unchanged values removed, the top 1 percent removed and the last pair of editions alone. For the Hubble constant, fix candidate truths in advance and report each.
- Preregistration SHA-256: fd8fcf7aeea1db717bce5553792bfbc63c88d7e69ee503256ccf7fc5215e2ec1. Plan SHA-256: adcbbf0f6bd1d24178e5ebaafcf3c7a5de1cca88489f5e5cdf7b1a754dec662c. Run 20261101T015415Z. Result SHA-256: 808cc6bdfb4881a9ef594399a848dc0cde0ecacfd73497e0e5f42b70524c613d.
Cost. The analysis took under two seconds on one desktop CPU and the two controls under one second. The study was not re-run for this paper.
Downloads
- Whitepaper, PDF F362.pdf, 3.6 MB
- BuildTeX source F362.bld, 35 KB
- Build receipt F362.buildtex.json, 1 KB
- BuildLang doc module doc.bld, 5 KB, imported by the source
The PDF is typeset by BuildTeX from F362.bld, which is written from the same source as this page. The receipt records the source's SHA-256 and the PDF's (712109ae8ebf), so anyone can rebuild it and compare. The copy here has its hidden author field blanked, as the site does for every file it publishes; blank the same field in a rebuild before comparing. The name stays on the first page.
Verified
Verified on 2026-11-09. On 9 November 2026 every n, coverage, needed multiple and nu in Table 1, the PDG and AME coverage intervals, the 0.35 unchanged PDG share, the Hubble constant values at all three proxies, the changes of assumption, the out-of-sample and shrink results, the planted recovery (2.405 against 2.394) and the honest normal control were re-read from the run's result file. They match the findings ledgerDefinition: findings ledger our records The append-only, dated list of every result we have recorded, numbered F1, F2 and on. Corrections are added as new dated lines and old entries are never rewritten. Excludes a curated list of successes. full definition, the dated append-only list of our results. The preregistration's SHA-256 matches the hash recorded in the result file. The figure was drawn by a script that reads only that result file. The 2018 to 2022 CODATA tracing (99 of 273 rows, 4.55 sigma) was read from the ledger entry for the later reading; this run's result file does not hold it.
Not checked. The study was not re-run for this paper. The cited papers were found by searches run on 9 November 2026 and read at the level of abstracts and search summaries; their full texts were not read for this paper.
Terms on this page
Each term is defined where it is first used on this page. Each name below opens its entry in the findings glossary, which lists every page that uses it.
- stated 1 sigma uncertainty metrology (the standard uncertainty of the GUM) and physics data tables first use
- coverage statistics and metrology first use
- preregistration research method (metascience) first use
- moved-values arm research method, our usage first use
- proxy truth research method, our usage first use
- planted check research method; called a positive control in experimental science first use
- control statistics and experimental design first use
- kill condition research method (our usage, after Popper's falsification) first use
- shift in units of the earlier sigma statistics, our usage; called a normalised residual in metrology first use
- needed multiple metrology, our usage; a coverage factor fitted after the fact first use
- Student t distribution and its tail index nu statistics first use
- Cauchy distribution probability first use
- bootstrap statistics, resampling first use
- 95% interval statistics first use
- honest normal world statistics, our control first use
- null distribution statistics first use
- p value (from draws) statistics first use
- shared inputs metrology and data evaluation first use
- verdict research method (our usage) first use
- findings ledger our records first use
To report an error, name the finding, the claim number and the source on the Work page, which gives the address. Accepted corrections join the Trail with their date.