
Findings F344 Physics, Computing and mathematics, Method and statistics found 2026-10-31
No cubic pattern in public Auger cosmic-ray directions, at sensitivity that sees only large ones
If space were a fine cubic grid, the highest-energy cosmic rays might arrive in a pattern aligned with its axes. In the public Pierre Auger sample we find no such pattern at any of five energy cuts, and our planted tests show the search could only have seen a strong one.
- Tier
- D, honest null
- Outcome
- honest null
- Rung
- hypothesis
- Verdicts
- 3 passed, 0 failed
- Corrections
- 1, latest 2026-10-31
- Version
- v2, 2026-11-09
- Redo it
- Reproduce
Download PDF 3.6 MB BuildTeX source F344.bld
What this means for a reader
The public share of the Auger data is small enough that only a large cubic imprint on the arrival directions would have shown up. So the result rules out a strong pattern and says nothing about a subtle one. Anyone citing public cosmic-ray data for or against a grid-like universe should quote the planted sensitivity beside the p value, and the full Auger dataset would do much better than the public share.
Objection
Only the public 10 percent of events was available, which is the main reason the sensitivity is low.
What would change the call. Our publication register records no condition that would raise or overturn this call.
From the paper's first stated limitation; our register records no separate objection.
Abstract
If space were a fine cubic grid, the highest-energy cosmic rays could arrive in a pattern aligned with its axes, a signature Beane, Davoudi and Savage proposed in 2012. We searched the public Pierre Auger Observatory data for such a pattern with a method fixed in advance. The data are the 25,086 main-array events in the public 10 percent sample and the catalogue of the highest-energy events, cut at 8, 16, 32, 40 and 78 EeV. For each cut we fitted a cube-symmetric pattern over 400 orientations and compared the best fit with skies whose right ascensions were scrambled, which keeps the detector's exposure. No cut shows a cubic pattern: raw p values run from 0.19 to 0.85, and all five read 0.85 after the Benjamini-Hochberg correction. The search could only have seen a strong pattern: at 8 EeV it reaches power 0.9 at a planted strength of 0.2, and at 32 EeV it reaches power 0.97 only at strength 1.0, where the sky along the cube axes is twice the average. The highest-energy event, 166 EeV, bounds the lattice spacing below 3.7e-27 m, an inverse spacing of 5.3e10 GeV, which is 0.53 of the 1e11 GeV bound of Beane and colleagues. This is a null whose value lies in stating how weak it is.
c1 observed, evidence for claim 1
- The numbers in claim 1
- 0.19; 0.85 matches the result file, 2026-11-09
- Chart 1
- How the search looks for a cube in the sky, and how it was checked.
- Chart 2
- Is there a cubic pattern at any energy cut?
- Basis
- observed: measured in this study, with a result file
c2 observed, evidence for claim 2
- The numbers in claim 2
- 8; 0.9; 0.2; 32; 0.97; 1.0 matches the result file, 2026-11-09
- Chart 1
- How the search looks for a cube in the sky, and how it was checked.
- Chart 4
- How strong a planted cubic pattern has to be before the search finds it.
- Basis
- observed: measured in this study, with a result file
c3 observed, evidence for claim 3
- The numbers in claim 3
- 166; 3.7e-27; 5.3e10; 0.53; 1e11 matches the result file, 2026-11-09
- Chart 5
- The bound on a lattice spacing from the highest-energy event, against the published one.
- Basis
- observed: measured in this study, with a result file
Introduction
Lattice calculations in particle physics put space and time on a grid. Beane, Davoudi and Savage [2] asked what an observer inside such a calculation could detect if the universe itself were computed on a grid with some lattice spacingDefinition: lattice spacing lattice field theory The distance between neighbouring points of a grid on which space is modelled. On a grid, waves shorter than about twice the spacing cannot exist and the speed of a wave depends on its direction. Excludes the Planck length, which is a scale built from constants and not a measured grid. full definition. Their abstract reports that the most stringent bound on the inverse spacing, about 1e11 GeV, comes from the high-energy end of the cosmic-ray spectrum, and their published account predicts that the highest-energy cosmic rays would show the cube symmetry of the grid in their arrival directions.
The particles that could carry that signature are the ultra-high-energy cosmic rayDefinition: ultra-high-energy cosmic ray astroparticle physics A charged particle from space, a proton or heavier nucleus, arriving with an energy above about 1e18 electronvolts. It is recorded through the shower of secondary particles it makes in the atmosphere. Excludes photons and neutrinos, and the far more common cosmic rays of lower energy. full definitions, with energies of many EeVDefinition: EeV physics (units) An exaelectronvolt, 1e18 electronvolts, or 1e9 GeV, carried by a single particle. Excludes the total energy of the shower in a detector, which is spread over many secondary particles. full definition. The Pierre Auger Observatory records them with an array of ground detectors. The Auger Collaboration reported in 2017 a large-scale anisotropy above 8 EeV, a dipole of about 6.5 percent amplitude in 3e4 events, which it reads as evidence that these particles come from outside our galaxy [3]. Since 2021 the collaboration has published 10 percent of its cosmic-ray events, with a catalogue of the highest-energy events added in 2023 [1].
We asked whether the public arrival directions carry a cubic pattern, and what the most energetic event says about the spacing. The decision it informed was how to describe public cosmic-ray data in any work of ours on discretised space: as evidence, or as a weak test. Our searches found the proposal above and the Auger anisotropy results and no published cubic search on the open data; that is what the searches returned, and it does not show that none exists.
Preregistration and design
The preregistrationDefinition: preregistration research method (metascience) A dated written plan for a study, fixed and hash-locked before any result is seen: the question, the data, the statistic, the controls, the forecasts and the kill conditions. Excludes a plan revised after looking at the outcome, and a protocol written only for the record after the run. full definition and the forecast file were written and hash-locked on 31 October 2026, before the run. They name the baseline (an isotropic sky at the data's declinations), the planted answer (a cubic pattern at random orientation), the controlDefinition: control statistics and experimental design A version of the data with the structure under test removed (for example shuffled or pooled), scored the same way as the real data, so the real score has something to beat. Excludes a comparison with a different dataset or with a published number. full definition (right-ascension scrambles), the outlier checks (the top 3 events and the region around Centaurus A, with and without), the assumption changed (the energy cut and the Centaurus A exclusion), and the kill condition.
The kill conditionDefinition: kill condition research method (our usage, after Popper's falsification) A rule written in the preregistration that, when met, decides against the claim with no room for judgement after the run. Excludes reasons found after the run for setting a result aside. full definition, fixed in advance: if the cubic search gives a corrected p below 0.01, the lattice reading must still survive the Centaurus A exclusion and a second energy cut, or it dies. Each forecast and condition became a rule set whose pass or fail is a verdictDefinition: verdict research method (our usage) The pass or fail of one preregistered rule set against the run's numbers, read off by code. Excludes an interpretation written after reading the numbers. full definition read off by code.
Data and provenance
The data are the Pierre Auger Observatory Open Data release of 2024 [1], Zenodo record 10488964, licensed CC BY-SA 4.0, fetched on 31 October 2026. We read the event summaries of the main surface array, vertical and inclined showers together with duplicates removed, which gave 25,086 events with direction and energy. This public sample is 10 percent of the recorded events. We also read the catalogue of the highest-energy surface-array events, 109 events with a top energy of 166 EeV. We report statistics only.
The cuts at 8, 16 and 32 EeV use the event summaries, and the cuts at 40 and 78 EeV use the catalogue. Table 1 gives the count at each cut.
Methods
The pattern
For an arrival direction written as a unit vector with components , , , the cubic harmonicDefinition: cubic harmonic mathematics (spherical harmonics) and crystallography The simplest pattern on a sphere with the symmetry of a cube: here x^4 + y^4 + z^4 minus its average, largest along the six cube axes and smallest along the eight diagonals. Excludes a dipole, a single hot spot, or any pattern that a rotation of the cube by a right angle would change. full definition is
The constant 0.6 is its average over the sphere, so averages to zero on an isotropic sky. It is largest, 0.4, along the six axes of the cube and smallest along the eight diagonals. A grid in space need not line up with our coordinates, so the pattern was rotated through 400 random orientations .
The statistic
A ground array does not watch the whole sky evenly: its exposureDefinition: exposure astroparticle physics How much of each part of the sky a detector watched over time. A ground array sees some declinations far more than others, so an isotropic sky still looks uneven in its data. Excludes the number of events, which is exposure times the true flux. full definition depends strongly on declination. The baseline sky was therefore built from 60,000 directions with uniform right ascension and declinations drawn from the data. For orientation , let and be the mean and standard deviation of on this baseline, and its mean over the real events. The standardised excess is
and the statistic is the largest over the 400 orientations. For cuts with 500 events or fewer, the baseline declinations were drawn from the 8 EeV events.
The null and the correction
Each p value comes from a right-ascension scrambleDefinition: right-ascension scramble astroparticle physics (anisotropy searches) A control sky made by keeping each event's declination and giving it a random right ascension. The Earth's rotation makes a ground array's exposure nearly even in right ascension, so the scramble keeps the exposure and removes any pattern. Excludes a fully random sky, which would ignore the detector's exposure. full definition: each event keeps its declination and gets a random right ascension, which keeps the exposure and removes any pattern. The statistic was recomputed on 300 scrambled skies, and
with the number of scrambles at or above the real and the number of scrambles. The five p values were corrected with the Benjamini-Hochberg correctionDefinition: Benjamini-Hochberg correction statistics (multiple testing) A rule that raises a set of p values to control the expected share of false discoveries among the tests called significant. The smallest raw p is multiplied by the number of tests and larger ones by less. Excludes an uncorrected p value read on its own when several tests were run. full definition [4]: with the raw values sorted so that is the th smallest of = 5,
and each corrected value is the smallest at its own rank or above.
Planted patterns
A planted sky keeps the real events' declinations and draws right ascensions from a density proportional to
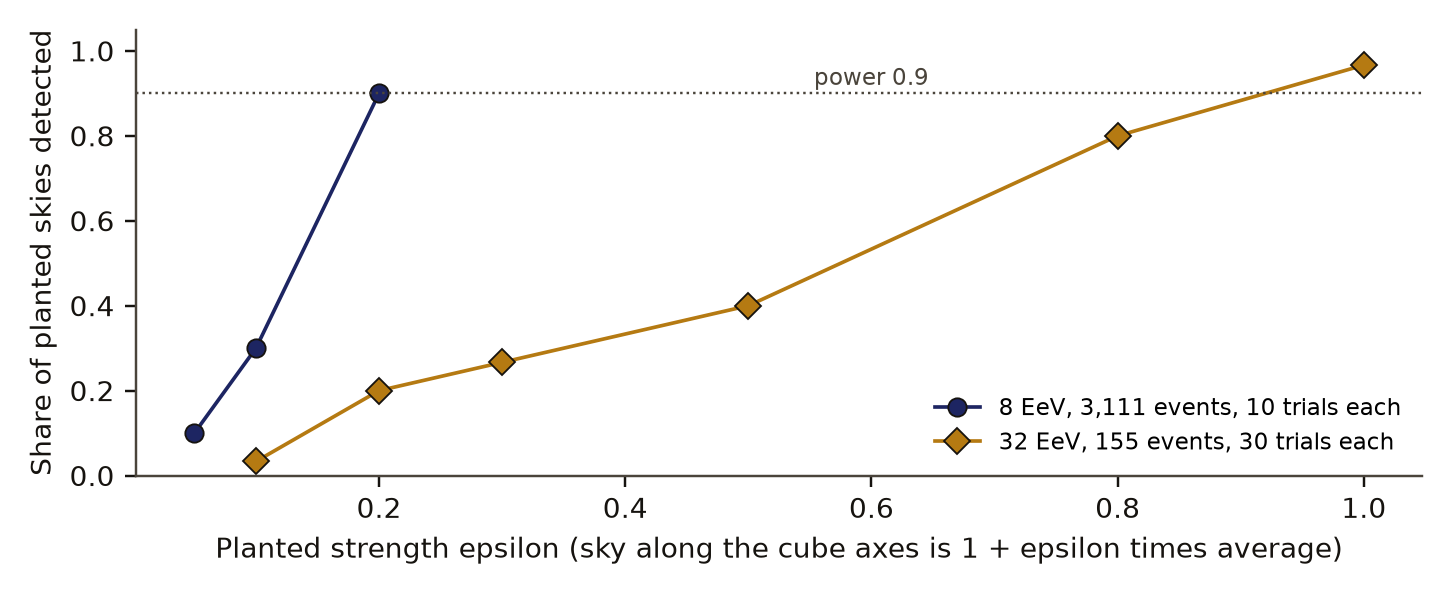
at one random orientation, so that the sky along the cube axes is times the average. The detection powerDefinition: detection power statistics The share of planted skies, each with a pattern of known strength, in which the search finds the pattern at its preregistered threshold. Excludes the chance that a pattern exists in the real sky. full definition at strength is the share of planted skies whose statistic exceeds the 95th percentile of scrambled skies. At 32 EeV the threshold came from 200 scrambles and each strength had 30 planted skies; at 8 EeV, 60 scrambles and 10 planted skies.
The kinematic reading
On a grid of spacing , a particle cannot have a wavelength much shorter than the grid. In the simple picture used here, a particle of energy could not propagate unless
where = 1.973e-16 GeV m is the reduced Planck constant times the speed of light. The inverse spacing in energy units is .
Controls and planted checks
The right-ascension scramble is the null for every p value. As a separate control at 32 EeV, 200 scrambled skies gave a mean statistic of 2.32 and a 95th percentile of 3.27; the real statistic, 1.69, sat well inside them (p value from drawsDefinition: p value (from draws) statistics The share of control draws scoring at or above the real score, with one added to the count and to the number of draws, so it is never zero. Excludes a p value from a textbook formula that assumes a distribution. full definition 0.87).
- data25,086 cosmic-ray eventsPublic Pierre Auger release. Cut at 8, 16, 32, 40, 78 EeV (1 EeV is 10 to the 18 electronvolts).
- measurementCubic statistic TMeasures how much the arrival directions bunch along the axes of a cube, over every orientation of the cube. At 32 EeV, T is 1.69.
- controlControl: scrambled skiesRight ascension shuffled, declination kept. At 32 EeV, 200 draws gave mean 2.32 and 95th percentile 3.27.
- planted checkPlanted: a cubic skyEvents drawn with a known cubic strength. At strength 1.0 and 32 EeV the search finds it in 0.97 of trials.
- rule set in advanceRule: corrected p below 0.01A pattern counts only if the smallest p value, corrected over the five cuts by Benjamini-Hochberg (a correction for running several tests), is below the bar.
- no cubic patternSmallest corrected p 0.85The null holds only for strong patterns: the planted check shows the search misses weak ones at 32 EeV.
Read from result.json, run 20261031T211927Z. SHA-256 of the run's file c057a3088f4ba56f1e9e24198ba11450f2a361ee56996a5e6f285a0a3c80d9a4 and of the published copy e0305fdf3d92b04de8acd905624c37a064b446c8b9a8da8049d6ec938744a3e2. In the copy, file paths are cut to the file name and the layout (indentation, line endings) may differ; every value is the same.
The planted checkDefinition: planted check research method; called a positive control in experimental science Data built so that the right answer is known, run through the same analysis before the real data, to show that the analysis can see the effect when it is there. Excludes any check made on the real data, which cannot show what the analysis misses. full definition measured the search's power at each strength. Figure 3 and Table 2 give the result. The planted powers are coarse: each is a share of 30 or of 10 trials.
The outlier checks removed the 28 events at 32 EeV within 27 degrees of Centaurus A, and separately the 3 highest-energy events, and recomputed the p value with 200 scrambles each.
Results
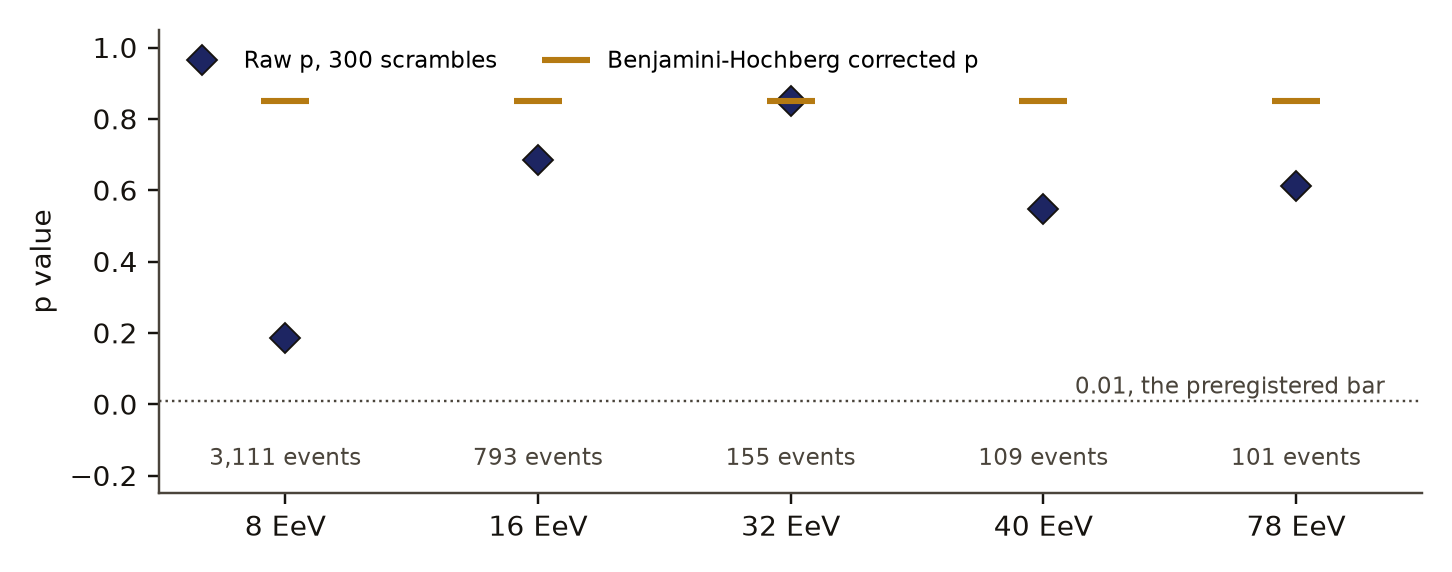
No cut shows a cubic pattern: raw p values run from 0.19 to 0.85, and all five read 0.85 after the Benjamini-Hochberg correction. Table 1 and Figure 2 give the values.
p value (a pattern needs less than 0.01)
- raw p
- p after Benjamini-Hochberg correction over the five cuts
- bar set in advance, 0.01
Data behind chart 2 5 rows
| Energy cut | Events | Statistic T | Raw p | Corrected p |
|---|---|---|---|---|
| 8 EeV | 3,111 | 2.74 | 0.19 | 0.85 |
| 16 EeV | 793 | 1.91 | 0.68 | 0.85 |
| 32 EeV | 155 | 1.69 | 0.85 | 0.85 |
| 40 EeV | 109 | 2.80 | 0.55 | 0.85 |
| 78 EeV | 101 | 2.79 | 0.61 | 0.85 |
Read from result.json, run 20261031T211927Z. SHA-256 of the run's file c057a3088f4ba56f1e9e24198ba11450f2a361ee56996a5e6f285a0a3c80d9a4 and of the published copy e0305fdf3d92b04de8acd905624c37a064b446c8b9a8da8049d6ec938744a3e2. In the copy, file paths are cut to the file name and the layout (indentation, line endings) may differ; every value is the same.
Removing the 28 events near Centaurus A or the 3 highest-energy events leaves no pattern at 32 EeV: p 0.38 and 0.71.
c4 observed, evidence for claim 4
- The numbers in claim 4
- 28; 3; 32; 0.38; 0.71 matches the result file, 2026-11-09
- Chart 3
- Does a handful of events hide a pattern at 32 EeV?
- Basis
- observed: measured in this study, with a result file
The search could only have seen a strong pattern: at 8 EeV it reaches power 0.9 at a planted strength of 0.2, and at 32 EeV it reaches power 0.97 only at strength 1.0, where the sky along the cube axes is twice the average.
power (share of planted skies found)
planted strength (1 is twice the average flux along the cube axes)
- 8 EeV cut
- 32 EeV cut
- power 0.9
Data behind chart 4 7 rows
| Planted strength | Power at 32 EeV | Power at 8 EeV |
|---|---|---|
| 0.05 | not run | 0.10 |
| 0.1 | 0.03 | 0.30 |
| 0.2 | 0.20 | 0.90 |
| 0.3 | 0.27 | not run |
| 0.5 | 0.40 | not run |
| 0.8 | 0.80 | not run |
| 1.0 | 0.97 | not run |
Read from result.json, run 20261031T211927Z. SHA-256 of the run's file c057a3088f4ba56f1e9e24198ba11450f2a361ee56996a5e6f285a0a3c80d9a4 and of the published copy e0305fdf3d92b04de8acd905624c37a064b446c8b9a8da8049d6ec938744a3e2. In the copy, file paths are cut to the file name and the layout (indentation, line endings) may differ; every value is the same.
The highest-energy event, 166 EeV, bounds the lattice spacing below 3.7e-27 m, an inverse spacing of 5.3e10 GeV, which is 0.53 of the 1e11 GeV bound of Beane and colleagues. The 1e11 GeV figure was entered from memory before the run; the abstract of Beane and colleagues [2], read for this paper, gives the same value.
The study also ran a toy model of waves on a cubic grid, to check the dispersion a lattice would cause. Along an axis, the phase speed falls short of the continuum value by , with the wavenumber, within 0.8 percent for up to 0.8. The group speed falls short by , within 1.3 percent; our forecast had given it the phase speed's coefficient, and that forecast missed. Along a diagonal, waves run faster than along an axis by , within 1.2 percent, and the model sets the highest energy along a diagonal at , 1.73, times that along an axis, from the grid's geometry. This direction dependence is what would imprint a cube on arrival directions.
Table 3 sets the forecasts written before the run against the outcomes.
The event forecast was made from memory of the full dataset; the public release holds a tenth of it.
Discussion
The search found nothing, and the planted skies say how little that means. At 32 EeV, the highest cut with event-level data, only 155 events are public, and the search needs a pattern that doubles the flux along the cube axes before it sees one reliably. At 8 EeV the sample is twenty times larger and the threshold falls to a 20 percent modulation, but at that energy the particles are bent strongly by galactic magnetic fields, which would smear a pattern made at the source.
For scale, the dipole the Auger Collaboration measured above 8 EeV with its full data has an amplitude of about 6.5 percent [3]. A cubic pattern of that size would be far below what our search can see in the public share. The kinematic reading lands within a factor of 2 of the published bound because both rest on the same top energy and the same simple argument; it adds a check of arithmetic and no new information.
The result therefore excludes a large cubic imprint on the public arrival directions and nothing smaller. The same method on the full Auger data would set a stronger limit.
Limitations
- Only the public 10 percent of events was available, which is the main reason the sensitivity is low.
- Cosmic rays at these energies are bent by galactic and intergalactic magnetic fields, and we did not model that; a lattice pattern at the source could be smeared before arrival.
- Only a cubic pattern was tested. Other grid symmetries and other signatures of a lattice were not.
- The scramble also removes the known dipole from the null skies. With partial sky coverage a dipole is not exactly independent of a cubic pattern, so a dipole could raise the statistic slightly; we did not test this.
- The planted powers rest on 30 or 10 trials per strength and are coarse.
- The 1e11 GeV bound was entered from memory and agrees with the abstract read for this paper; the full paper was not read.
- Scoring was by our own code and was not blind.
Evidence
Honest null. Only strong cubic patterns are ruled out: power 0.9 at planted strength 0.2 at 8 EeV, and at 32 EeV only at strength 1.0, where the sky along the cube axes is twice the average.
Figures
These are the paper's own figures, numbered as in the PDF, and each "Figure" reference in the text points here. The charts on this page redraw the same results from the result files and carry their own numbers.
Tables
| Cut | Events | Statistic T | Raw p | Corrected p |
|---|---|---|---|---|
| 8 EeV | 3,111 | 2.74 | 0.19 | 0.85 |
| 16 EeV | 793 | 1.91 | 0.68 | 0.85 |
| 32 EeV | 155 | 1.69 | 0.85 | 0.85 |
| 40 EeV | 109 | 2.80 | 0.55 | 0.85 |
| 78 EeV | 101 | 2.79 | 0.61 | 0.85 |
| Planted strength | Power at 32 EeV | Power at 8 EeV |
|---|---|---|
| 0.05 | not run | 0.10 |
| 0.1 | 0.03 | 0.30 |
| 0.2 | 0.20 | 0.90 |
| 0.3 | 0.27 | not run |
| 0.5 | 0.40 | not run |
| 0.8 | 0.80 | not run |
| 1.0 | 0.97 | not run |
| Quantity | Forecast | Outcome |
|---|---|---|
| Events above 32 EeV | about 2,600 | 155 |
| Cubic search, no pattern | p above 0.05, probability 0.9 | all raw p 0.19 or above |
| Strength for power 0.9 | about 0.12, band 0.05 to 0.3 | 0.2 at 8 EeV; about 1.0 at 32 EeV |
| Kinematic reading against 1e11 GeV | within a factor of 3 | 0.53 |
| Group speed on axis | deficit within 1 percent | deficit |
| Axis minus diagonal | within 5 percent | within 1.2 percent |
| Highest energy, diagonal over axis | square root of 3 | 1.73, set by the model |
Appendix A. The preregistered verdicts
Each verdict is a set of rules written before the run. A verdict passes only when every rule holds. Values are read from the run's result file.
| Verdict | Deciding rule | Value | Holds |
|---|---|---|---|
| Cubic pattern absent | smallest corrected p above 0.01 | 0.85 | yes |
| Planted power | power at strength 1.0, 32 EeV, at least 0.9 | 0.97 | yes |
| Kinematic reading | ratio to 1e11 GeV between 0.33 and 3 | 0.53 | yes |
What lowers it
- scoring Scored by code and by the agent that ran it; self-graded. from our publication register, on who scored it
- blinding Not blind, as the paper's limitations state. from the paper's Limitations
- imprecision Only strong cubic patterns are ruled out: power 0.9 at planted strength 0.2 at 8 EeV, and at 32 EeV only at strength 1.0, where the sky along the cube axes is twice the average. from the bound stated under Evidence
- depth of reading The cited literature was read at the level of abstracts, publisher pages and search summaries; full texts were not read. from the Verified section
What holds it up
- preregistration Preregistered and hash-locked before the run (sha256 1b0153b4). from the Reproduce section
Where the claim stands
- lead
- hypothesis
- thesis
- conjecture
- theorem
- law candidate
- killed
A preregistration with pass-or-fail rules is on file, which this rung needs. The next rung needs a named rival reading beaten by a decisive observation, and none is on file. Tier D: Null with stated power.
Trail
Versions
- v2 2026-11-09, paper version 1.0, first published PDF sha256 9e8df4ecb6223e12
- v1 2026-10-31, entered in the findings ledger
Corrections
2026-10-31 scope found by a review of our findings ledger
A review of our ledger noted that the public 10 percent of the data gives 155 events at 32 EeV and low power, with planted power needing strength 1.0 there. now The claim was narrowed to a large pattern, as here.
Standing, and the ledger entries it rests on
2026-10-31 narrowed in part F422
Set by hand from findings ledger entry F422, dated 2026-10-31: sensitivity. Rests on findings ledger, F422 correction pass.
Each correction is a dated note; the findings ledger is never rewritten, and a note governs where it differs.
Ledger and version dates up to publication are local dates in US Pacific time. Clock times in the text are UTC, seven or eight hours ahead, so a lock or a run stamped just after midnight UTC belongs to the previous local day. Corrections from 14 November 2026 on are dated in UTC.
References
- Pierre Auger Collaboration. Auger Open Data release 2024. Zenodo record 10488964. doi:10.5281/zenodo.10488964. Licence CC BY-SA 4.0. Described in: Pierre Auger Collaboration (2024). The Pierre Auger Observatory open data. The European Physical Journal C. doi:10.1140/epjc/s10052-024-13560-5. arXiv:2309.16294 run here Licence: as stated in the paper's data section used in Introduction, Data and provenance
- Beane, S. R., Davoudi, Z. and Savage, M. J. (2014). Constraints on the universe as a numerical simulation. The European Physical Journal A. doi:10.1140/epja/i2014-14148-0. arXiv:1210.1847 abstract or summary, 2026-11-09: abstracts, publisher pages and search summaries; full text not read used in Introduction, Results
- Pierre Auger Collaboration (2017). Observation of a large-scale anisotropy in the arrival directions of cosmic rays above 8 x 10^18 eV. Science 357, 1266-1270. doi:10.1126/science.aan4338. arXiv:1709.07321 abstract or summary, 2026-11-09: abstracts, publisher pages and search summaries; full text not read used in Introduction, Discussion
- Benjamini, Y. and Hochberg, Y. (1995). Controlling the false discovery rate: a practical and powerful approach to multiple testing. Journal of the Royal Statistical Society, Series B 57, 289-300. abstract or summary, 2026-11-09: abstracts, publisher pages and search summaries; full text not read used in Methods
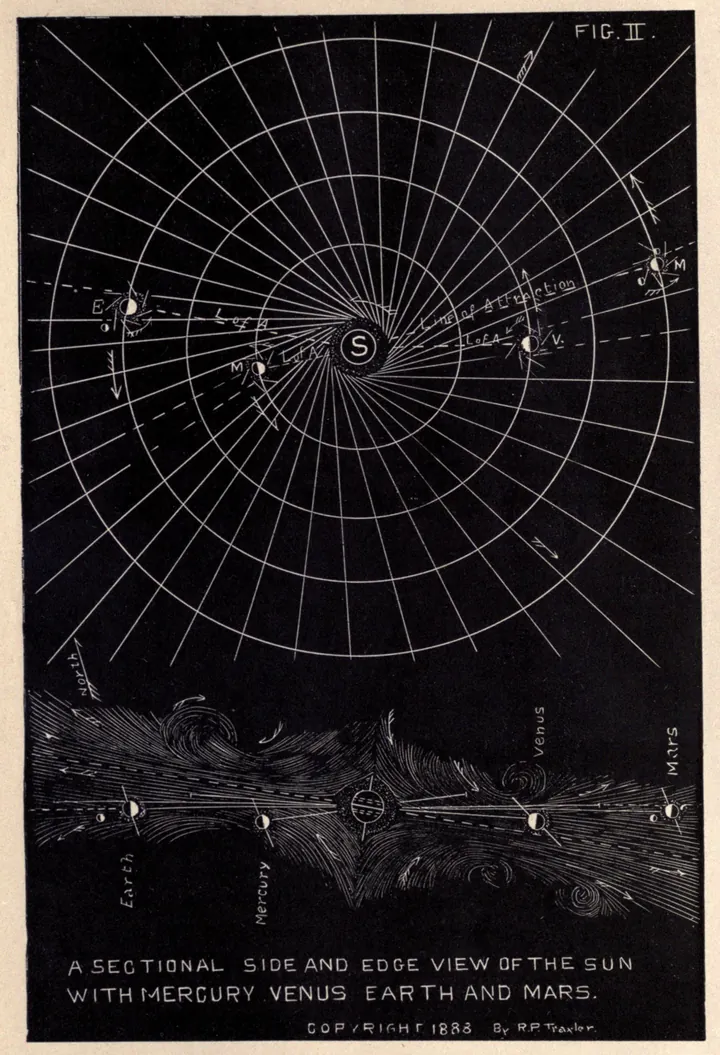
- Traxler, R. P. (1889). The Principles of Mechanics as Applied to the Solar System. San Francisco: C. A. Murdock and Co. Internet Archive item principlesofmech00traxiala. read in full: the scan, read in full on the Internet Archive used in Introduction
Cited by later findings
- F422 narrowed in part, sensitivity, 2026-10-31 (record findings ledger, F422 correction pass). A later review of our ledger recorded one error: the public 10 percent sample has low power, so the claim covers large patterns only.
Reproduce
Data
- Pierre Auger Collaboration. Licence: as stated in the paper's data section. https://doi.org/10.5281/zenodo.10488964
Preregistration
sha256 1b0153b42a6fffc2789b98f6f2bd9774da4c0da48bda7e22e51266e9bd5f0f29
plan 6785b5da63d8a3597424d3b4d72015ad4bf66979959f281bb55fda7df057548b
Steps
- Data: the Pierre Auger Observatory Open Data release 2024, Zenodo record 10488964 (CC BY-SA 4.0): the surface-array event summaries and the highest-energy catalogue.
- Cut at 8, 16 and 32 EeV in the summaries and at 40 and 78 EeV in the catalogue.
- For each cut, compute eq. 2 over 400 random orientations of eq. 1 against an exposure-matched baseline, keep the largest, and compute eq. 3 from 300 right-ascension scrambles. Correct with eq. 4.
- Plant eq. 5 at a random orientation into skies with the real declinations to measure power. Remove the events near Centaurus A and the top 3 events and recompute.
- Apply eq. 6 to the top energy.
- Preregistration SHA-256: 1b0153b42a6fffc2789b98f6f2bd9774da4c0da48bda7e22e51266e9bd5f0f29. Plan SHA-256: 6785b5da63d8a3597424d3b4d72015ad4bf66979959f281bb55fda7df057548b. Run 20261031T211927Z.
Cost. The analysis took about 138 s and the scramble control about 3 s on one desktop CPU. The study was not re-run for this paper.
Downloads
- Whitepaper, PDF F344.pdf, 3.6 MB
- BuildTeX source F344.bld, 29 KB
- Build receipt F344.buildtex.json, 1 KB
- BuildLang doc module doc.bld, 5 KB, imported by the source
The PDF is typeset by BuildTeX from F344.bld, which is written from the same source as this page. The receipt records the source's SHA-256 and the PDF's (9e8df4ecb622), so anyone can rebuild it and compare. The copy here has its hidden author field blanked, as the site does for every file it publishes; blank the same field in a rebuild before comparing. The name stays on the first page.
Verified
Verified on 2026-11-09. On 9 November 2026 the 25,086 events read, the catalogue count and top energy, the counts, statistics and raw p values at each cut, the corrected value of 0.85, the Centaurus A and top-3 p values with the 28 events removed, every planted power and the 32 EeV threshold, the scramble control's mean, percentile and p, the spacing bound, the inverse spacing and the 0.53 ratio, the lattice dispersion errors and the three verdicts were re-read from the run's result file. They match the findings ledgerDefinition: findings ledger our records The append-only, dated list of every result we have recorded, numbered F1, F2 and on. Corrections are added as new dated lines and old entries are never rewritten. Excludes a curated list of successes. full definition. The data source and licence were read from the download's source record. The preregistration's SHA-256 matches the hash recorded in the result file and in the lock file. Both figures were drawn by a script that reads only that result file.
Not checked. The study was not re-run for this paper. The literature was found by searches run on 9 November 2026 and read at the level of abstracts, publisher pages and search summaries; the full texts were not read. The Benjamini and Hochberg paper is cited for the method only and was not searched or read for this paper.
Terms on this page
Each term is defined where it is first used on this page. Each name below opens its entry in the findings glossary, which lists every page that uses it.
- lattice spacing lattice field theory first use
- ultra-high-energy cosmic ray astroparticle physics first use
- EeV physics (units) first use
- preregistration research method (metascience) first use
- control statistics and experimental design first use
- kill condition research method (our usage, after Popper's falsification) first use
- verdict research method (our usage) first use
- cubic harmonic mathematics (spherical harmonics) and crystallography first use
- exposure astroparticle physics first use
- right-ascension scramble astroparticle physics (anisotropy searches) first use
- Benjamini-Hochberg correction statistics (multiple testing) first use
- detection power statistics first use
- p value (from draws) statistics first use
- planted check research method; called a positive control in experimental science first use
- findings ledger our records first use
To report an error, name the finding, the claim number and the source on the Work page, which gives the address. Accepted corrections join the Trail with their date.