
Findings F329 Psychology and perception, Society and economics found 2026-10-31
In held-out private die-roll reports, about 45 percent read as honest, and this method cannot tell us why
Payoff maximisation says everyone in a private die-roll task should claim the top number. Of 58 published studies with 27,039 subjects, 19 papers with 9,960 subjects were held out. In their tasks with three or more outcomes the reports read as about 45 percent honest, 26 percent claiming the maximum and 29 percent in between; the result file gives no interval and the reading depends on the method. Six competing theories fit those reports almost equally well, and our planted check failed, so the tie shows only that this method could not separate them.
- Tier
- B, signal
- Outcome
- mixed
- Rung
- hypothesis
- Verdicts
- 3 passed, 3 failed
- Kill rule
- fired
- Corrections
- 3, latest 2026-11-14
- Version
- v3, 2026-11-14
- Redo it
- Reproduce
Download PDF 571 KB BuildTeX source F329.bld
What this means for a reader
Most people given a free, safe chance to lie for money do not take all of it. Close to half report what they saw, about a quarter claim the top number and the rest shade upward partway. A model in which lying has a fixed cost, one in which people care about looking honest, one in which they follow what others do, and a plain payoff model with enough noise all reproduce those reports almost equally well. To learn which motive is at work, you need experiments designed to pull the motives apart. The distribution of reports alone is not enough.
Objection
The planted check failed, so the near-tie says nothing about which model is true, and the model ranking in Table 1 is not a result.
What would change the call. Our publication register records no condition that would raise or overturn this call.
From the paper's first stated limitation; our register records no separate objection.
Abstract
In a private die or coin task a person sees a random outcome alone and is paid by the number they report, so a lie pays and cannot be caught. Payoff maximisation says everyone should claim the top outcome. We used the open meta-study data of Abeler, Nosenzo and Raymond: 252 first-round treatments from 58 papers with 27,039 subjects, split by paper so that 19 papers with 9,960 subjects were held out. On held-out tasks with three or more outcomes, reports read as 45 percent honest, 26 percent maximal and 29 percent partial. Six preference models were fitted on the other papers and scored on the held-out ones. All six sit within 0.005 nats per report of each other, and no contrast against the fixed-cost model passes the false-discovery correction. The planted check failed: on data simulated from the reputation model, the reputation model lost to the fixed-cost model by 0.0003 nats per report. By the preregistered rule, no ranking among the models counts. Our subset's mean standardised report was 0.287 against the 0.234 published for the full data, outside the preregistered tolerance of 0.03. The departure from strict self-interest is large; the mechanism behind it is not identified by report distributions.
c1 observed, evidence for claim 1
- The numbers in claim 1
- 45; 26; 29 matches the result file, 2026-11-09
- Chart 5
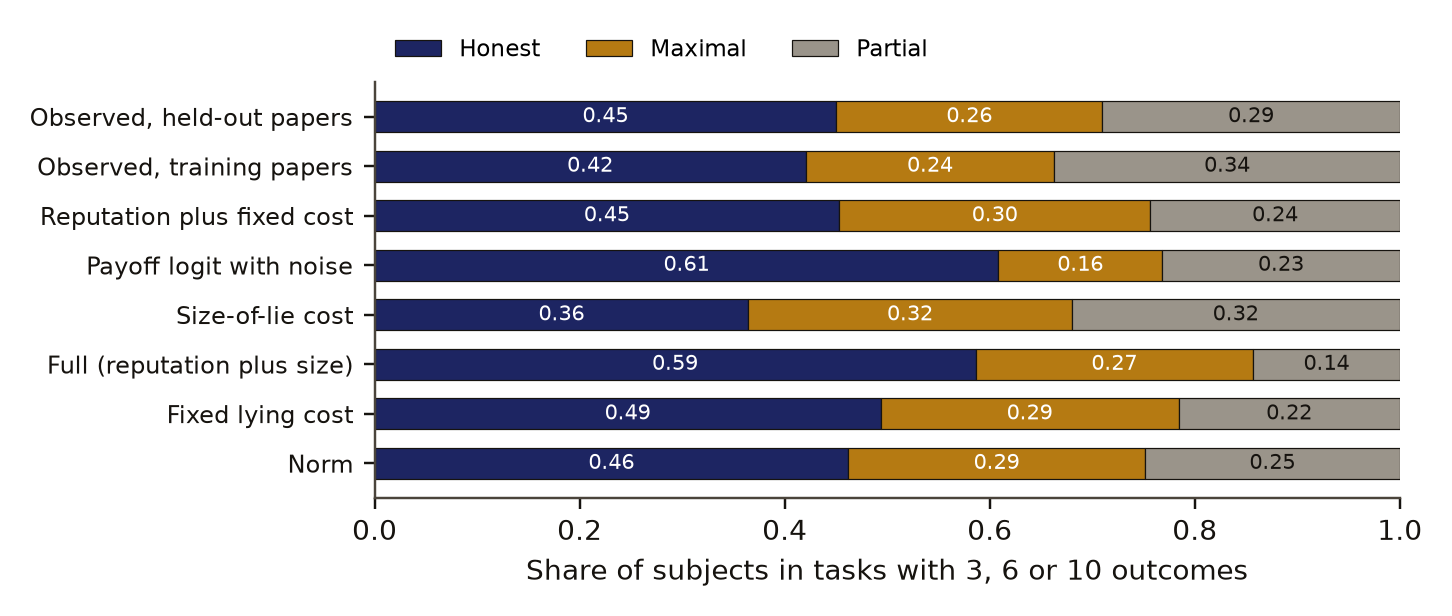
- How people report when a task has three or more outcomes: honest, maximal or partial.
- Basis
- observed: measured in this study, with a result file
c2 observed, evidence for claim 2
- The numbers in claim 2
- 0.005 matches the result file, 2026-11-09
- Chart 3
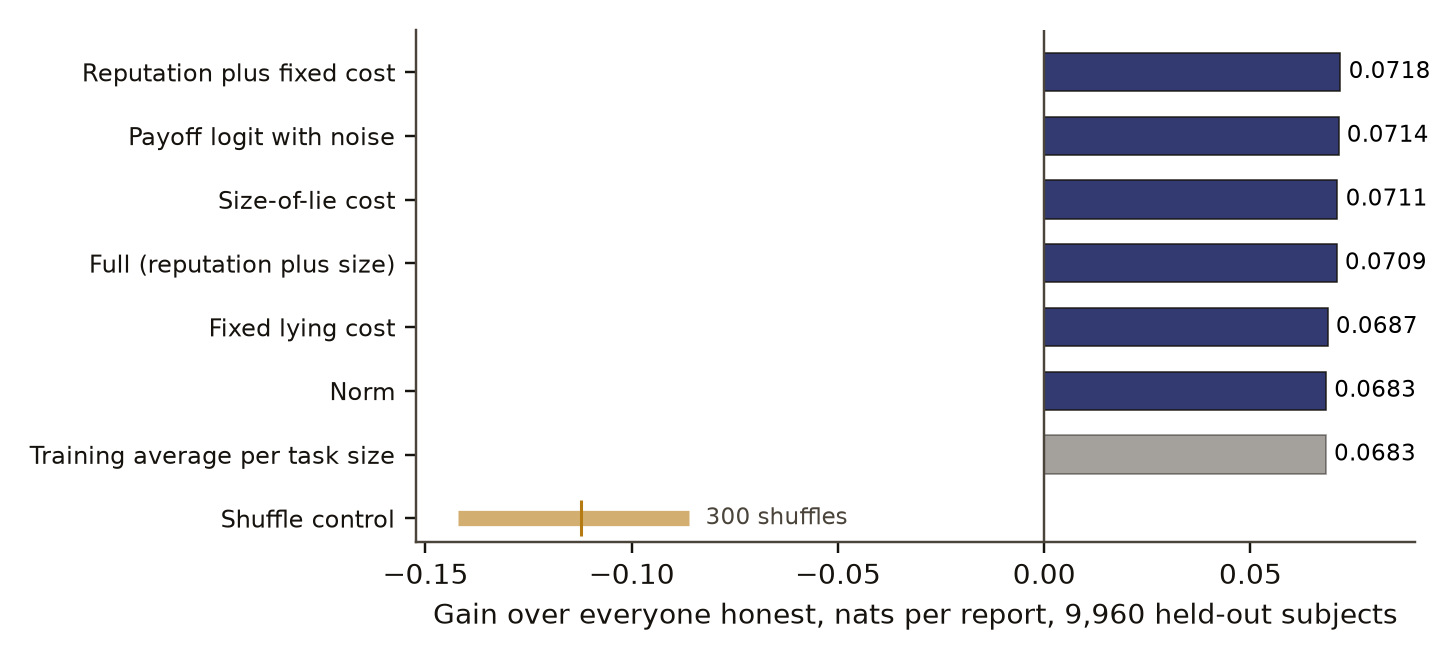
- How much better each theory of lying predicts held-out reports than assuming everyone is honest.
- Chart 4
- Edge of the two richer models over the fixed-cost model on held-out papers.
- Basis
- observed: measured in this study, with a result file
c3 observed, evidence for claim 3
- The numbers in claim 3
- 0.0003 matches the result file, 2026-11-09
- Chart 1
- Planted check: on reports simulated from the reputation model, does the reputation model win?
- Basis
- observed: measured in this study, with a result file
c4 observed, evidence for claim 4
- The numbers in claim 4
- 0.287; 0.234; 0.03 matches the result file, 2026-11-09
- Chart 2
- Reproduction check: mean standardised report in our subset against the published figure.
- Basis
- observed: measured in this study, with a result file
Introduction
Fischbacher and Föllmi-Heusi [3] made the private reporting taskDefinition: private reporting task (die-under-the-cup) experimental economics and psychology An experiment in which a person observes a random outcome in private, such as a die roll or coin toss, reports it, and is paid by the report, so a lie pays and cannot be caught for any one person. Lying shows only in the distribution of many reports. Excludes tasks where the experimenter can see each person's true outcome. full definition a standard tool. Subjects rolled a die under a cup, reported the number, and were paid by it. No single lie could be detected, and the honest distribution is known, so lying shows in the reports as a whole. They found many fully honest subjects, a smaller group who lied to the maximum, and a large group of partial liars who lied but did not claim the top payoff, which they read as a wish to keep a favourable self-image.
Gächter and Schulz [4] ran the die task in 23 countries and related intrinsic honesty to a national index of the prevalence of rule violations built from corruption, tax evasion and political fraud. They found more honest reporting in subject pools from countries with fewer violations.
Abeler, Nosenzo and Raymond [1] combined data from 90 studies across economics, psychology and sociology and found that people lie surprisingly little. They derived predictions that separate the leading models, tested them with new experiments, and concluded that a preference for being honest together with a preference for being seen as honest best explains the behaviour. They published their data [2].
This paper asks a narrower question of that public data. Without the designed treatments that Abeler and colleagues used to separate the models, can the plain report distributions of ordinary first-round tasks tell the models apart on papers the models have not seen? And what share of reports look honest, maximal or partial?
Preregistration and design
The design was written as a preregistrationDefinition: preregistration research method (metascience) A dated written plan for a study, fixed and hash-locked before any result is seen: the question, the data, the statistic, the controls, the forecasts and the kill conditions. Excludes a plan revised after looking at the outcome, and a protocol written only for the record after the run. full definition and hash-locked on 31 October 2026 at 22:02 UTC, before any model was fitted. Two things were seen first, and both are stated in the locked file. The publishers' site gives a mean standardised report of 0.234. Our parsing step printed pooled report distributions over all 252 treatments, held-out ones included, and printed a mean standardised report of 0.287. The forecasts of report shares are therefore not blind to the pooled shape.
The locked file names the data and its filters, the six models and two baselines, the score, the paper-level tests, the three-part reading, the planted checkDefinition: planted check research method; called a positive control in experimental science Data built so that the right answer is known, run through the same analysis before the real data, to show that the analysis can see the effect when it is there. Excludes any check made on the real data, which cannot show what the analysis misses. full definition, a reproduction check, a controlDefinition: control statistics and experimental design A version of the data with the structure under test removed (for example shuffled or pooled), scored the same way as the real data, so the real score has something to beat. Excludes a comparison with a different dataset or with a published number. full definition, the forecasts and the kill conditionsDefinition: kill condition research method (our usage, after Popper's falsification) A rule written in the preregistration that, when met, decides against the claim with no room for judgement after the run. Excludes reasons found after the run for setting a result aside. full definition. Its assumptions are listed in it: true outcomes are uniform; upward lies come from preference only and downward lies only from mistakes; one population spans countries and subject pools; only first rounds are used; and the norm model has no measured norm input. Nothing was added after the run.
Kill conditions, without discretion:
- If the planted check fails, no model comparison counts.
- If the best theory's gain over everyone-honest is not above the shuffle control's 95th percentile, the theories carry nothing beyond chance.
Reproduction check: the mean standardised report over the by-treatment set must lie within 0.03 of 0.234.
Data and provenance
The data are the merged meta-study file and the data-and-programs archive published by Abeler, Nosenzo and Raymond [2] on their resources page and on figshare (files 16211150 and 16211414), downloaded on 31 October 2026. The site states that all its data are released under the CC BY licence, with credit and a link back. The files were read as data; no program in the archive was run. The publishers' site describes the full set as 429 treatments from 90 papers with over 44,000 participants in 47 countries.
A parsing step kept first-round reports from tasks with uniform true outcomes and 2, 3, 6 or 10 possible outcomes. It removed treatments coded in the data as internal lying or as having a victim, treatments that asked subjects about the report distribution, and treatments that told subjects what others reported. That left 252 treatments from 58 papers with 27,039 subjects. Papers were split by a hash of the citation, with 30 percent held out: the held-out papersDefinition: held-out papers statistics, cross-validation Papers kept out of all fitting, chosen by a hash of the citation (30 percent of papers), on which every model is scored once. All treatments from one paper fall on the same side. Excludes a split by treatment or subject, which would let one paper's design appear in both fitting and scoring. full definition were 19 papers with 9,960 subjects, and fitting used 17,079 subjects.
As a check on the parsing, the baseline treatment of Fischbacher and Föllmi-Heusi in our file has counts of 38, 44, 64, 76, 171 and 219 from the lowest to the top payoff. Our results summary records the top report at 36 percent, where honest reporting gives 17.
Methods
Models
Let a task have outcomes, ranked by payoff, with the rank of report scaled from 0 for the lowest to 1 for the highest. A person who saw outcome and reports receives the scaled payoff times a stakes factor
where is the money at stake in the treatment in purchasing-power dollars and is the stakes elasticityDefinition: stakes elasticity behavioural economics, our parametrisation The parameter epsilon in a stakes factor (G/5) to the power 1 minus epsilon, where G is the money at stake. At epsilon 1 the size of the payment has no effect on reports, and at 0 the pull to lie grows in proportion to the payment. Excludes the effect of payment on whether people take part. full definition. Each person also carries a lying cost , drawn from a lognormal distribution, with standard normal, evaluated on a grid of 25 quantiles. Each person picks the report with the highest utility
where is 1 when differs from and 0 otherwise, is the payoff distance , and is the chance that a person making report is honest. Each model keeps some of these terms:
- Fixed cost: the first cost term only. A person either reports honestly or claims the top.
- Size cost: the second cost term only, so the cost grows with the size of the lie.
- Reputation: the fixed cost plus the value on looking honest. Because depends on everyone's reports, it is solved as a fixed pointDefinition: fixed point (reputation model) game theory A report distribution that, when used to compute how honest each report looks, leads people to make the same distribution of reports. Found here by repeated damped updates starting from honest reporting. Excludes a guarantee that the fixed point found is the only one. full definition by 25 damped updates from honest reporting.
- Norm: the fixed cost scaled by , where is the share of others who lie, iterated from no lying, which finds the low-lying equilibrium.
- Full: reputation plus the size cost.
A trembleDefinition: tremble game theory and behavioural economics A parameter that mixes a share of uniformly random reports into a model's prediction, standing for mistakes and inattention. In these models it is the only source of downward lies. Excludes a preference, since the tremble does not depend on payoffs. full definition mixes in uniform reports, so a model's prediction for report is , with the share of the cost grid choosing . The payoff model has no cost and no tremble. It is a logit choice on money alone with one scale parameter :
Two baselines frame the models: everyone honest, which predicts uniform reports, and the training-average baselineDefinition: training-average baseline forecast verification, where it is called climatology A forecast that gives each held-out treatment the average report distribution of training treatments with the same number of outcomes. Excludes any theory of why people report as they do. full definition. Every model was fitted by maximum likelihoodDefinition: maximum likelihood statistics Fitting a model's parameters by choosing the values that make the observed data most probable under the model. Excludes choosing parameters by hand or by fit to the test data. full definition on the training papers.
Score
Models are scored by log lossDefinition: log loss (nats per report) statistics and forecast verification Minus the average natural log of the probability a model gave to each report that was made. Lower is better, and the difference between two models in nats per report is how much better one predicts each report. Excludes an accuracy count, which ignores how much probability a model gave to what happened. full definition over the held-out subjects, with the count of report in treatment :
A model's gain is the everyone-honest loss minus its own. Each theory model is compared with the fixed-cost model by a paper-level sign permutation testDefinition: paper-level sign permutation test statistics A test that sums each held-out paper's difference in log loss between two models, then flips the sign of each paper's difference at random 5,000 times to see how often a sum as large arises with no true difference. Excludes a test that treats subjects within one paper as independent. full definition, the p values adjusted together by the Benjamini-Hochberg correctionDefinition: Benjamini-Hochberg correction statistics, multiple testing A rule that adjusts a set of p values so that, among the tests called significant, the expected share of false calls stays at or below a chosen rate q, here 0.05. Excludes the stricter Bonferroni rule, which bounds the chance of any false call. full definition. The reputation and full models' differences from fixed cost also get a 95% intervalDefinition: 95% interval statistics The range that holds the middle 95 percent of the bootstrap or control draws for a number. We report it beside the number. Excludes a statement that the true value lies inside with 95 percent probability. full definition from a paper bootstrapDefinition: paper bootstrap statistics An interval made by recomputing a statistic 2,000 times on held-out papers drawn with replacement, so subjects from one paper stay together. Excludes resampling single subjects as if they were independent. full definition.
Shares of honest, maximal and partial reports
For each task size of 3, 6 or 10, reports are pooled and given a three-part readingDefinition: three-part reading experimental economics, after Fischbacher and Föllmi-Heusi A split of a report distribution into honest reporters, read as the number of outcomes times the share reporting the lowest outcome, maximal liars, the excess at the top over the honest share, and partial liars, the rest. Excludes an observation of any person's lie; it assumes the true outcomes are uniform and that no one lies downward on purpose. full definition. With the share reporting the lowest outcome and the share reporting the top,
with capped at 1, and the partial share is . The three task sizes are combined weighted by subjects. Two-outcome tasks are left out, since they have no partial lie.
Standardised report
For the reproduction check each report is mapped to , and the standardised reportDefinition: standardised report experimental economics; the measure Abeler, Nosenzo and Raymond report, computed here by our own code The mean report of a treatment after the outcomes are mapped evenly onto -1 for the lowest-paying report and +1 for the highest, so honest reporting gives 0 in expectation and everyone claiming the top gives 1. Here averaged over treatments without weights. Excludes a share of liars, which the mean alone does not give. full definition is averaged over the treatments without weights:
Controls and planted checks
The planted check simulated report counts from the reputation model at known parameters on the same treatments, kept the same split by paper, fitted the fixed-cost, size-cost and reputation models to the simulated training papers and scored them on the simulated held-out papers. The reputation model had to beat both. The planted check failed: on data simulated from the reputation model, the reputation model lost to the fixed-cost model by 0.0003 nats per report. It beat the size-cost model by 0.0005. The fitted reputation parameters also missed the planted ones: the log of the value on looking honest, , was planted at 0.2 and fitted at -0.56. The method cannot recover a known model at this sample size, so by the kill condition no ranking of the real models counts.
| Rule | Measured | Bar | Held |
|---|---|---|---|
| Reputation beats fixed cost | −0.0003 | above 0 | failed |
| Reputation beats size-of-lie cost | 0.0005 | above 0 | held |
Data behind chart 1 7 rows
| Rule | Measured | Bar | Held |
|---|---|---|---|
| Reputation minus fixed cost | −0.0003 | above 0 | no |
| Reputation minus size-of-lie cost | 0.0005 | above 0 | yes |
| Planted parameter 1: true, then fitted | 0.60 | 0.82 | |
| Planted parameter 2: true, then fitted | −0.70 | −0.46 | |
| Planted parameter 3: true, then fitted | 0.90 | 0.86 | |
| Planted parameter 4: true, then fitted | −3.00 | −2.41 | |
| Planted parameter 5: true, then fitted | 0.20 | −0.56 |
Read from result.json, run 20261031T220208Z. SHA-256 of the run's file e1a5ad3eb72c809945223d6da98310f19a66a073ca06b34cc9a49a18eb62adce and of the published copy 484c610760b26dee82852e9d8ede758162cf02456e07d3264d0649b0cc6704ed. In the copy, file paths are cut to the file name and the layout (indentation, line endings) may differ; every value is the same.
The shuffle control permuted report labels within each held-out treatment, and the best model's gain over everyone-honest was recomputed 300 times to give a null distributionDefinition: null distribution statistics The spread of scores a control gives over many random draws. Its 95th percentile is the bar a real score must clear. Excludes a theoretical distribution assumed rather than drawn from the data. full definition. Its 95th percentile was -0.086 (mean -0.112). The real best gain of 0.072 lies far above it (p from drawsDefinition: p value (from draws) statistics The share of control draws scoring at or above the real score, with one added to the count and to the number of draws, so it is never zero. Excludes a p value from a textbook formula that assumes a distribution. full definition 0.003). The theories carry information beyond chance, and this kill condition did not fire.
The reproduction check failed. Our subset's mean standardised report was 0.287 against the 0.234 published for the full data, outside the preregistered tolerance of 0.03. The two numbers come from different sets: ours uses first rounds only and drops several designs. Our filtered subset does not reproduce the publishers' headline figure, and the 0.287 was printed before the lock, so the outcome of this check was knowable when the plan was written.
Results
Table 1 and Figure 1 give the held-out losses. Every model beats everyone-honest by about 0.07 nats per report. All six sit within 0.005 nats per report of each other, and no contrast against the fixed-cost model passes the false-discovery correction. The reputation model's edge over fixed cost was 0.003 (95% interval -0.001 to 0.008, p 0.40), and the full model's 0.002 (-0.008 to 0.012, p 0.75). The training-average baseline, which has no theory in it, scored the same as the norm model to four places.
gain over everyone honest, nats per report (higher is better)
- gain over everyone honest
- shuffle control, 5th to 95th percentile
- control mean
- everyone honest, 0
Data behind chart 3 8 rows
| Model | Held-out loss | Gain over everyone honest | p against fixed cost |
|---|---|---|---|
| Reputation plus fixed cost | 1.2484 | 0.0718 | 0.40 |
| Payoff logit (no lying cost) | 1.2488 | 0.0714 | 0.83 |
| Size-of-lie cost | 1.2491 | 0.0711 | 0.83 |
| Full model | 1.2493 | 0.0709 | 0.75 |
| Fixed lying cost | 1.2515 | 0.0687 | |
| Norm | 1.2519 | 0.0683 | 0.81 |
| Training average (no theory) | 1.2519 | 0.0683 | 0.96 |
| Everyone honest | 1.3202 | 0.0000 |
Read from result.json, run 20261031T220208Z. SHA-256 of the run's file e1a5ad3eb72c809945223d6da98310f19a66a073ca06b34cc9a49a18eb62adce and of the published copy 484c610760b26dee82852e9d8ede758162cf02456e07d3264d0649b0cc6704ed. In the copy, file paths are cut to the file name and the layout (indentation, line endings) may differ; every value is the same.
edge over fixed cost, nats per report (above 0 is better)
- 95 percent interval from the result file
- no edge, 0
Data behind chart 4 3 rows
| Contrast | Edge | Lower end | Upper end | p |
|---|---|---|---|---|
| Reputation minus fixed cost | 0.0031 | −0.0009 | 0.0083 | 0.40 |
| Full minus fixed cost | 0.0022 | −0.0078 | 0.0119 | 0.75 |
| Full minus fixed cost without Effron et al. 2015 | −0.0031 |
Read from result.json, run 20261031T220208Z. SHA-256 of the run's file e1a5ad3eb72c809945223d6da98310f19a66a073ca06b34cc9a49a18eb62adce and of the published copy 484c610760b26dee82852e9d8ede758162cf02456e07d3264d0649b0cc6704ed. In the copy, file paths are cut to the file name and the layout (indentation, line endings) may differ; every value is the same.
The payoff model was forecast to do worse than honest reporting. With its logit noise it did better, by 0.071 nats per report, and finished second. A model with no lying cost at all fits these reports almost as well as the cost models.
The fitted stakes elasticities were 0.89 to 0.96 across the five cost models, so the size of the payment hardly moved reports in these data.
On held-out tasks with three or more outcomes, reports read as 45 percent honest, 26 percent maximal and 29 percent partial. The training papers gave 42, 24 and 34 percent. Table 2 and Figure 2 set those against the shares each fitted model predicts for the held-out tasks.
One held-out paper carries the full model's small edge. In Effron and colleagues' 2015 study (2,151 subjects), the full model beat fixed cost by 0.021 nats per report; without that paper, the full model's edge over fixed cost becomes -0.003. Across the 23 subject pools of Gächter and Schulz [4] in the data, the mean standardised report ranged from 0.18 to 0.58 (standard deviation 0.10).
Two sensitivity refits, scored on matching held-out subsets, are in Table 3. The fixed-cost model scored best of the three theories refitted in both. Among students the training average beat every theory; in the general population it lost to all three. The refit without hand-coded treatments was not run, because too few treatments remained.
Table 4 sets the forecasts written before the run against the outcomes.
Discussion
The departure from strict payoffs is the part that holds. Payoff maximisation predicts that every report is the top one; held-out reports show a top share of about a quarter beyond the honest share and a large honest share, consistent with what Fischbacher and Föllmi-Heusi [3] and Abeler and colleagues [1] report. The reading of those shares rests on the uniform-truth assumption and on there being no deliberate downward lies.
The mechanism is not identified here. Six models built on different motives, and a training average with no motive at all, predict held-out reports to within 0.005 nats per report. The planted check places part of the problem in the design: when the reputation model was true, the method still could not pick it out. Report distributions from ordinary tasks constrain the shape of reporting and leave the motive open.
This does not contradict Abeler and colleagues [1]. Their conclusion rests on designed treatments that change what a report signals about the reporter, which this study did not refit. Our result says that the distributions alone are not enough, which is the reason such treatments are needed.
The payoff logit's second place deserves care. A logit with a single scale parameter puts most weight on high reports and spreads the rest, and on these data that shape matches the reports about as well as a cost model. Its predicted shares are the furthest from the observed ones (Table 2), so a fit on log loss and a fit on shares can disagree.
Limitations
- The planted check failed, so the near-tie says nothing about which model is true, and the model ranking in Table 1 is not a result.
- The preregistered reproduction check failed: our subset gives 0.287 against the publishers' 0.234, and that value was printed before the lock.
- One held-out paper, Effron and colleagues (2015), carries the full model's edge; without it the sign flips.
- The shares are read from distributions, not observed lies. They assume uniform true outcomes and upward lies from preference only.
- The pooled report shapes were seen before the lock, so the share forecasts were not blind.
- All tasks are laboratory or online die and coin tasks with 2, 3, 6 or 10 outcomes, first rounds only.
- The designed treatments that separate the models were removed by our filters and not refitted.
- Scoring was done by our own code and was not blind.
- The three-part reading is not neutral between models. The fixed-cost model has no partial liars by construction, yet its predicted reports read as 22 percent partial under this reading (Table 2). The 29 percent partial and the 45 percent honest read from the real reports carry the same bias, of unknown size.
Evidence
Mixed. The planted check failed: the method did not recover a known model at this sample size (the planted model trailed its rival by 0.0003 nats per report). By the preregistered kill condition no ranking among the six models counts. The reports do differ from a shuffled control, and the shares read from the held-out reports are a description.
Figures
These are the paper's own figures, numbered as in the PDF, and each "Figure" reference in the text points here. The charts on this page redraw the same results from the result files and carry their own numbers.
Tables
| Model | Loss | Gain | p against fixed cost |
|---|---|---|---|
| Reputation plus fixed cost | 1.2484 | 0.0718 | 0.40 |
| Payoff logit | 1.2488 | 0.0714 | 0.83 |
| Size-of-lie cost | 1.2491 | 0.0711 | 0.83 |
| Full | 1.2493 | 0.0709 | 0.75 |
| Fixed lying cost | 1.2515 | 0.0687 | reference |
| Norm | 1.2519 | 0.0683 | 0.81 |
| Training average | 1.2519 | 0.0683 | 0.96 |
| Everyone honest | 1.3202 | 0 | not tested |
| Subset | Subjects | Fixed cost | Reputation | Full | Training average | Everyone honest |
|---|---|---|---|---|---|---|
| Students | 7,109 | 1.4285 | 1.4301 | 1.4338 | 1.4241 | 1.5188 |
| General population | 2,851 | 0.8067 | 0.8107 | 0.8067 | 0.8262 | 0.8249 |
| Quantity | Forecast | Outcome |
|---|---|---|
| Best theory model | full | reputation, within noise |
| Order | full, reputation, size, fixed, norm, payoff | reputation, payoff, size, full, fixed, norm |
| Payoff worse than everyone honest | yes | no, better by 0.071 |
| Full over fixed cost | 0.02 | 0.002 |
| Training average over best model | 0.005 | -0.004 |
| Stakes elasticity | 0.9 | 0.89 to 0.96 |
| Honest, maximal, partial | 0.42, 0.25, 0.33 | 0.45, 0.26, 0.29 |
| Reputation share error | 0.10 | 0.110 |
| Fixed-cost share error | 0.20 | 0.116 |
Appendix A. The preregistered verdicts
Each verdictDefinition: verdict research method (our usage) The pass or fail of one preregistered rule set against the run's numbers, read off by code. Excludes an interpretation written after reading the numbers. full definition is a set of rules written before the run, and it passes only when every rule holds. Values are read from the run's result file. Because the planted check failed, the two model contrasts that pass are voidDefinition: void research method (our usage) The verdict of a run whose planted check failed or whose sample fell below its stated minimum. It says nothing for or against the claim. Excludes a null result, which comes from a working instrument. full definition as rankings, and neither passes the correction for multiple tests.
| Verdict | Deciding rule | Value | Holds |
|---|---|---|---|
| Planted check | reputation beats fixed cost and size cost on simulated reputation data | -0.0003; 0.0005 | no |
| Beats shuffle | best gain above shuffle 95th percentile (-0.086) | 0.072 | yes |
| Payoff below honest | payoff gain over everyone honest below 0 | 0.071 | no |
| Reputation over fixed cost | difference above 0 | 0.003 | yes |
| Full over fixed cost | difference above 0 | 0.002 | yes |
| Training average above best | training average's loss lower than the best model's | -0.004 | no |
| Reproduction | mean standardised report within 0.03 of 0.234 | 0.287 | no |
What lowers it
- scoring Scored by code and by the agent that ran it; self-graded. from our publication register, on who scored it
- blinding Not blind, as the paper's limitations state. from the paper's Limitations
- depth of reading The cited literature was read at the level of abstracts, publisher pages and search summaries; full texts were not read. from the Verified section
What holds it up
- preregistration Preregistered and hash-locked before the run (sha256 bff18a49). from the Reproduce section
Where the claim stands
- lead
- hypothesis
- thesis
- conjecture
- theorem
- law candidate
- killed
A preregistration with pass-or-fail rules is on file, which this rung needs. The next rung needs a named rival reading beaten by a decisive observation, and none is on file. Tier B: Real data and a held-out design, with a useful negative: this method could not tell the six models apart. The reproduction check against the published mean failed (0.287 against 0.234, tolerance 0.03).
Trail
Versions
- v3 2026-11-14, this page corrected, 2 items; the PDF and its BuildTeX source are still paper version 1.0
- v2 2026-11-09, paper version 1.0, first published PDF sha256 3610edab4bbafad7
- v1 2026-10-31, entered in the findings ledger
Corrections
2026-11-14 wording found by a review of the published pages
A review of the published page found that the three-part reading is biased between models. now The fixed-cost model allows no partial liars, yet its predicted reports read as 22 percent partial under this reading, so the 29 percent partial and 45 percent honest read from the real reports depend on the method. The limitations and the summary now say so.
2026-11-14 scope found by a review of the published pages
A review of the published page found the title and summary wider than the result. now The 45 percent comes from held-out tasks with three or more outcomes, part of the 9,960 held-out subjects, and has no interval; 27,039 is the whole sample. The near-tie among six theories was presented as showing the reports cannot identify a theory; the planted check failed, so it shows only that this method could not separate them. The title and summary now say so, and the outcome word changed from held to mixed because a kill condition fired.
2026-11-09 scope found by the publication pass
A dated correction in our findings ledgerDefinition: findings ledger our records The append-only, dated list of every result we have recorded, numbered F1, F2 and on. Corrections are added as new dated lines and old entries are never rewritten. Excludes a curated list of successes. full definition records that the preregistered reproduction check failed at 0.287 against 0.234 within 0.03. now The original ledger entry did not state it. The claim stands narrowed, and this paper states the failed check in the abstract, the controls and the limitations.
Standing, and the ledger entries it rests on
2026-10-31 narrowed in part F422
Set by hand from findings ledger entry F422, dated 2026-10-31: reproduction check. Rests on findings ledger, F422 correction pass and Publication pass corrections 2026-11-09.
Each correction is a dated note; the findings ledger is never rewritten, and a note governs where it differs.
Ledger and version dates up to publication are local dates in US Pacific time. Clock times in the text are UTC, seven or eight hours ahead, so a lock or a run stamped just after midnight UTC belongs to the previous local day. Corrections from 14 November 2026 on are dated in UTC.
References
- Abeler, J., Nosenzo, D. and Raymond, C. (2019). Preferences for truth-telling. Econometrica 87(4), 1115-1153. doi:10.3982/ECTA14673 abstract or summary, 2026-11-09: abstracts, publisher pages and search summaries; full text not read used in Introduction, Discussion, Discussion
- Abeler, J., Nosenzo, D. and Raymond, C. Preferences for truth-telling: data and programs. Resources page of www.preferencesfortruthtelling.com; figshare files 16211150 and 16211414. CC BY. Downloaded 31 October 2026. run here Licence: as stated in the paper's data section used in Introduction, Data and provenance
- Fischbacher, U. and Föllmi-Heusi, F. (2013). Lies in disguise: an experimental study on cheating. Journal of the European Economic Association 11(3), 525-547. doi:10.1111/jeea.12014 abstract or summary, 2026-11-09: abstracts, publisher pages and search summaries; full text not read used in Introduction, Discussion
- Gächter, S. and Schulz, J. F. (2016). Intrinsic honesty and the prevalence of rule violations across societies. Nature 531, 496-499. doi:10.1038/nature17160 abstract or summary, 2026-11-09: abstracts, publisher pages and search summaries; full text not read used in Introduction, Results
Cited by later findings
- F422 narrowed in part, reproduction check, 2026-10-31 (record findings ledger, F422 correction pass and Publication pass corrections 2026-11-09). A later review of our ledger recorded a failed planted check, an error and an explanation added after the result; on 2026-11-09 the ledger added that the preregistered reproduction check failed at 0.287 against 0.234 within 0.03.
Reproduce
Data
- Abeler, J., Nosenzo, D. Licence: as stated in the paper's data section.
Preregistration
sha256 bff18a49df2fb811b8d8039a83d150a5a9d202a5e355ed8a4b79d5738c10f705
plan 76393962abab4576b991da0082fd66316b78ddcd9620080a11c4fc247ae73763
Steps
- Data: download the merged meta-study file from the resources page of Abeler, Nosenzo and Raymond (figshare file 16211150), CC BY.
- Keep first-round reports from uniform tasks with 2, 3, 6 or 10 outcomes; drop internal-lying, victim, asked-distribution and information treatments; split papers 70 to 30 by a hash of the citation.
- Fit the six models of eqs. 2 and 3 by maximum likelihood on the training papers and score held-out loss with eq. 4.
- Read the three shares with eqs. 5 and 6, and the standardised report with eq. 7.
- Preregistration SHA-256: bff18a49df2fb811b8d8039a83d150a5a9d202a5e355ed8a4b79d5738c10f705. Plan SHA-256: 76393962abab4576b991da0082fd66316b78ddcd9620080a11c4fc247ae73763. Run 20261031T220208Z.
Cost. The analysis took about six minutes and the shuffle control under one second on one desktop computer, as timed in the result file. The study was not re-run for this paper.
Downloads
- Whitepaper, PDF F329.pdf, 571 KB
- BuildTeX source F329.bld, 37 KB
- Build receipt F329.buildtex.json, 1 KB
- BuildLang doc module doc.bld, 5 KB, imported by the source
The PDF is typeset by BuildTeX from F329.bld, which is written from the same source as this page. The receipt records the source's SHA-256 and the PDF's (3610edab4bba), so anyone can rebuild it and compare. The copy here has its hidden author field blanked, as the site does for every file it publishes; blank the same field in a rebuild before comparing. The name stays on the first page.
Verified
Verified on 2026-11-09. On 9 November 2026 the subject and paper counts of the split, the eight held-out losses and gains, the permutation p values and their correction, the two bootstrap intervals, the shuffle control's draws and percentiles, the planted check's values and fitted parameters, the observed and predicted shares and the share errors, the stakes elasticities, the Effron sensitivity, the Gächter and Schulz range, the baseline counts, the sensitivity refits, the mean standardised report of 0.287 and all six verdicts were re-read from the run's result file. The 252 treatments, 58 papers and 27,039 subjects, the filters, the forecasts and the 0.234 comparison value were read from the preregistration; the publishers' full-set figures were read from our results summary of 31 October 2026. The results match the findings ledger and its dated correction of 9 November 2026. The preregistration's SHA-256 was recomputed on that date and matches the hash in the result file. The data source and licence were read from our download record. Both figures were drawn by a script that reads only the result file. The model forms in the methods were read from the study's code. The 36 percent top share was read from our results summary.
Not checked. The study was not re-run for this paper. The literature was found by searches run on 9 November 2026 and read at the level of abstracts, publisher pages and search summaries; the full texts were not read.
Terms on this page
Each term is defined where it is first used on this page. Each name below opens its entry in the findings glossary, which lists every page that uses it.
- private reporting task (die-under-the-cup) experimental economics and psychology first use
- preregistration research method (metascience) first use
- planted check research method; called a positive control in experimental science first use
- control statistics and experimental design first use
- kill condition research method (our usage, after Popper's falsification) first use
- held-out papers statistics, cross-validation first use
- stakes elasticity behavioural economics, our parametrisation first use
- fixed point (reputation model) game theory first use
- tremble game theory and behavioural economics first use
- training-average baseline forecast verification, where it is called climatology first use
- maximum likelihood statistics first use
- log loss (nats per report) statistics and forecast verification first use
- paper-level sign permutation test statistics first use
- Benjamini-Hochberg correction statistics, multiple testing first use
- 95% interval statistics first use
- paper bootstrap statistics first use
- three-part reading experimental economics, after Fischbacher and Föllmi-Heusi first use
- standardised report experimental economics; the measure Abeler, Nosenzo and Raymond report, computed here by our own code first use
- null distribution statistics first use
- p value (from draws) statistics first use
- verdict research method (our usage) first use
- void research method (our usage) first use
- findings ledger our records first use
To report an error, name the finding, the claim number and the source on the Work page, which gives the address. Accepted corrections join the Trail with their date.