
Findings F320 Method and statistics, Psychology and perception found 2026-10-31
A random split scores a stress classifier perfect on data with nothing to learn
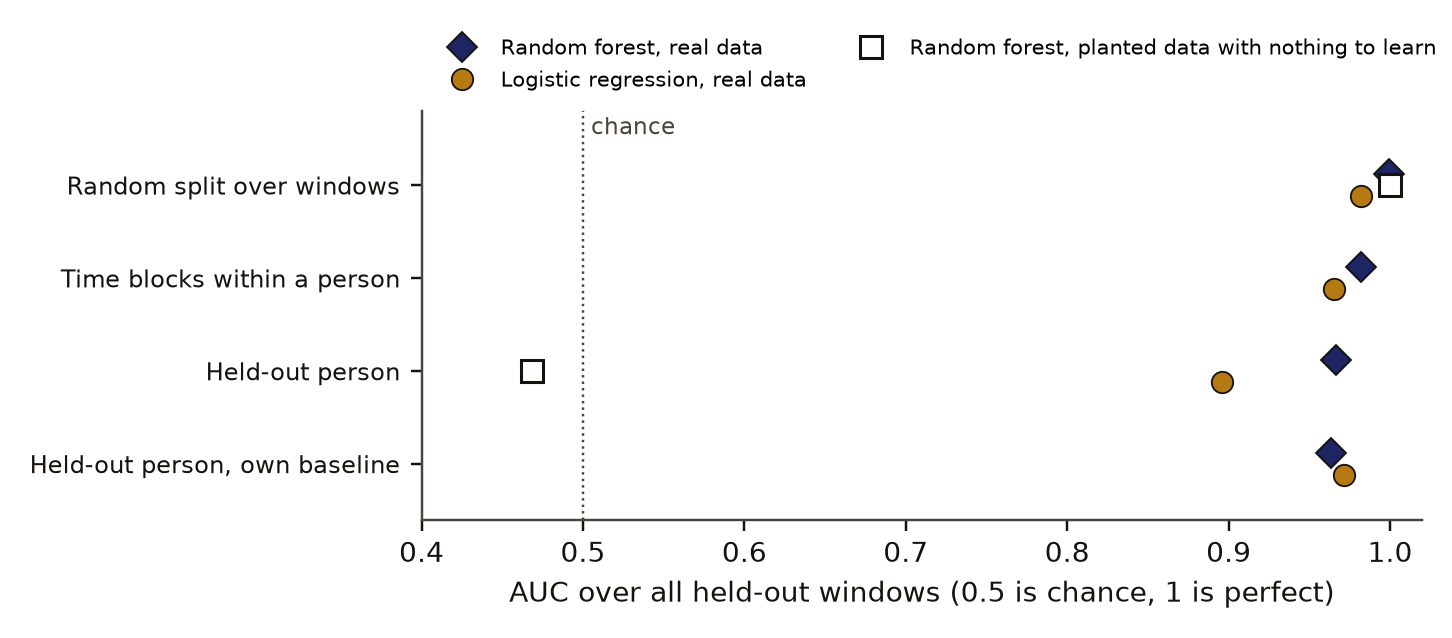
On planted data where nothing carries from one person to the next, a random train-test split still gives a perfect score of 1.00, while holding out whole people gives chance. On the real WESAD recordings the classifier does hold across 15 people, at an AUC of 0.966, and how stressed people said they felt did not track how much their bodies changed.
- Tier
- B, signal
- Outcome
- held
- Rung
- hypothesis
- Verdicts
- 10 passed, 1 failed
- Corrections
- 3, latest 2026-11-14
- Version
- v3, 2026-11-14
- Redo it
- Reproduce
Download PDF 601 KB BuildTeX source F320.bld
What this means for a reader
If a paper reports a near-perfect stress classifier, look for how it split the data. When neighbouring windows share most of their samples and land on both sides of a random split, the model can score perfectly by recognising the recording, with no stress signal at all. In our test that happened exactly. On the real data the classifier did hold for new people, which is good news for this one laboratory protocol, but only a split that holds out whole people could show it.
Objection
Fifteen people, one laboratory, one protocol, about one hour each. A held-out person is a stranger only inside this sample.
What would change the call. Our publication register records no condition that would raise or overturn this call.
From the paper's first stated limitation; our register records no separate objection.
Abstract
Wearable stress detectors are often scored by cutting recordings into overlapping windows and splitting the windows at random into training and test sets. We tested what that split measures. On planted data built on the same windows and timing as the WESAD recordings, where each person and each condition block carries its own random offsets and nothing carries from one person to the next, a random split over windows scored an AUC of 1.000 and a held-out-person split scored 0.469. On the real chest recordings of 15 people (2,122 windows of 60 s, 30 percent of them stress), the random forest held across people at a held-out-person AUC of 0.966, against 1.000 under the random split. The random split inflated the AUC by 0.033 for the random forest and 0.086 for logistic regression. ECG, EDA and skin temperature together reached 0.97 for a held-out person, and acceleration with EMG reached 0.79. Across the 15 people, the rise in reported anxiety did not follow the size of the bodily change: Spearman rho 0.03 with EDA, 0.02 with heart rate and -0.45 with breathing rate (p 0.09). The first run failed its own planted check because we set its bar at 0.90, within 0.012 of the best score that planted shift allows; a second preregistered run repaired the plant and passed.
c1 observed, evidence for claim 1
- The numbers in claim 1
- 1.000; 0.469 matches the result file, 2026-11-09
- Chart 1
- Two ways to hold data out, and a planted data set with nothing to learn that tells them apart.
- Chart 2
- The same model scored two ways: random split over windows against a held-out person.
- Basis
- observed: measured in this study, with a result file
c2 observed, evidence for claim 2
- The numbers in claim 2
- 0.966; 1.000 matches the result file, 2026-11-09
- Chart 2
- The same model scored two ways: random split over windows against a held-out person.
- Chart 3
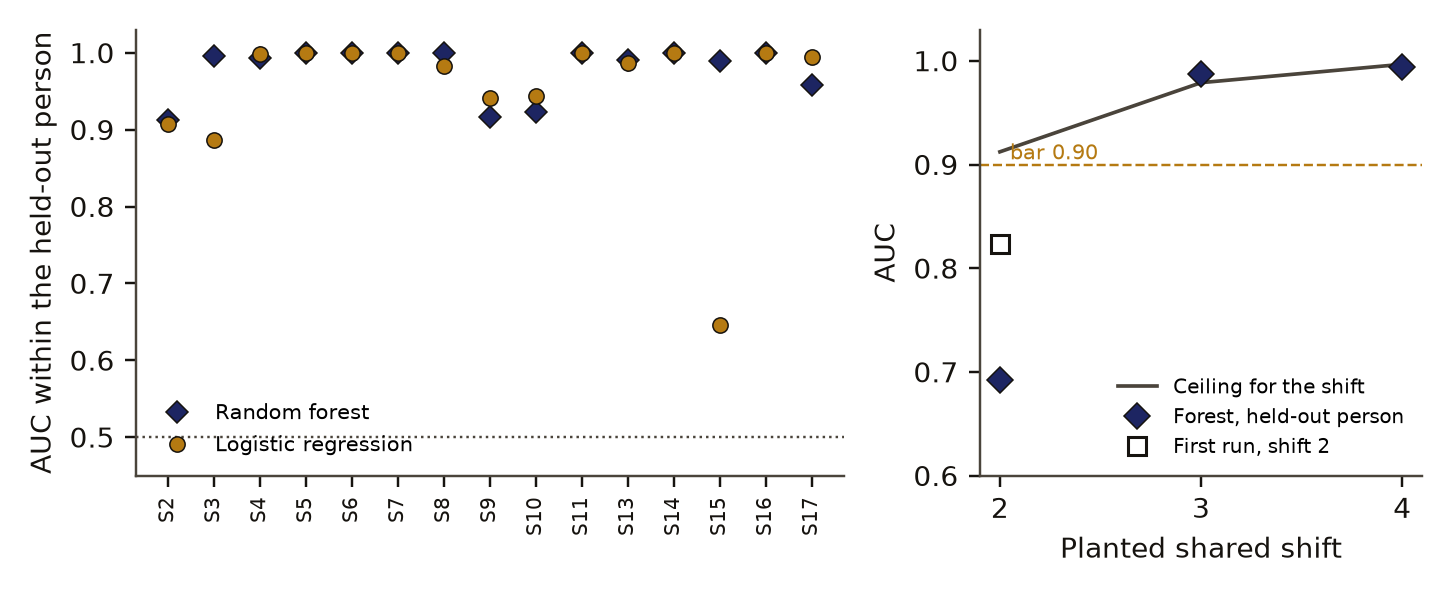
- Each held-out person's own AUC under both models.
- Basis
- observed: measured in this study, with a result file
c3 observed, evidence for claim 3
- The numbers in claim 3
- 0.033; 0.086 matches the result file, 2026-11-09
- Chart 2
- The same model scored two ways: random split over windows against a held-out person.
- Basis
- observed: measured in this study, with a result file
c4 observed, evidence for claim 4
- The numbers in claim 4
- 0.97; 0.79 matches the result file, 2026-11-09
- Chart 4
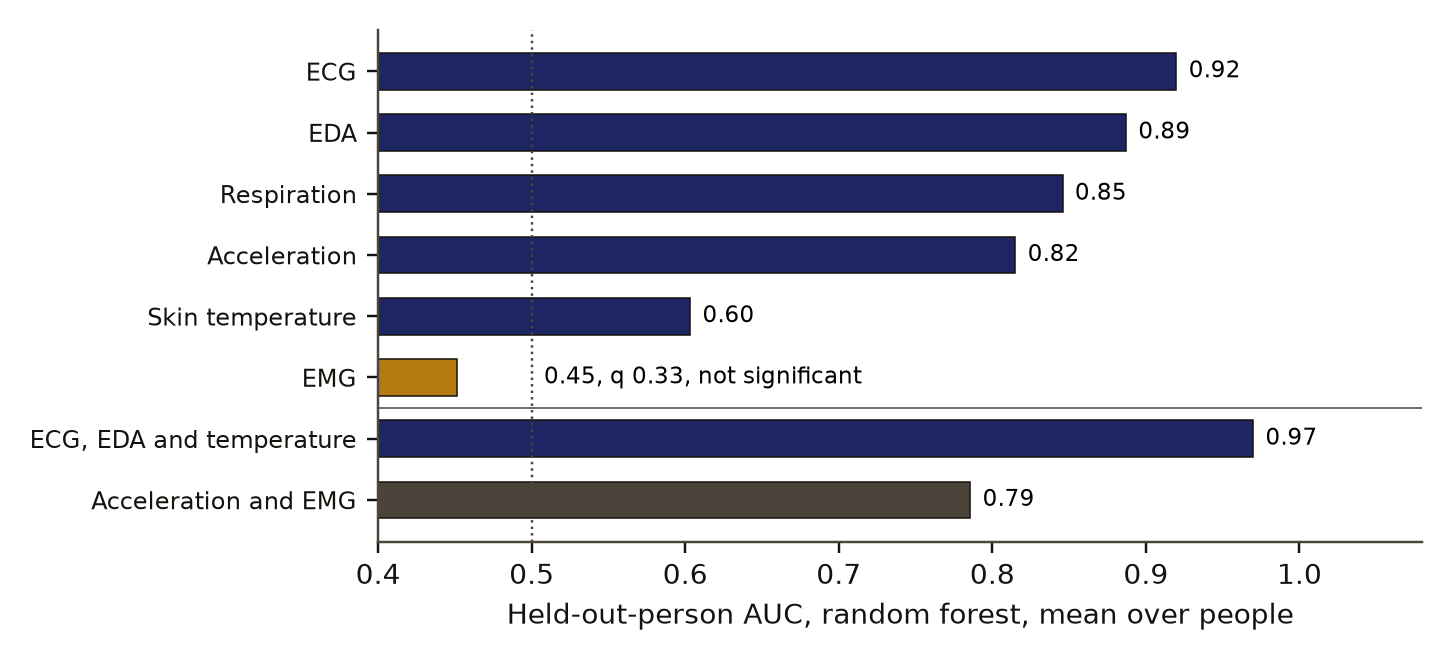
- Which sensors carry stress to a person the model has not seen.
- Basis
- observed: measured in this study, with a result file
c5 observed, evidence for claim 5
- The numbers in claim 5
- 15; 0.03; 0.02; -0.45; 0.09 matches the result file, 2026-11-09
- Chart 5
- Did people who reported a larger rise in anxiety also change more in the body?
- Basis
- observed: measured in this study, with a result file
Introduction
WESAD, the Wearable Stress and Affect Detection dataset of Schmidt and colleagues [1], records 15 people with a chest sensor and a wrist sensor during a baseline, amusing film clips and the Trier Social Stress TestDefinition: Trier Social Stress Test psychology and psychoneuroendocrinology A laboratory stressor in which a person prepares and gives a short public talk and then does mental arithmetic aloud in front of an evaluating panel. Excludes daily stress, chronic stress and trauma. full definition, in which a person gives a short public talk and then does mental arithmetic aloud before an evaluating panel. The dataset paper reports classifiers scored with every person held out in turn, and WESAD has since become a common benchmark.
Many later studies score their models with a random split over windowsDefinition: random split over windows machine learning evaluation; called record-wise cross-validation in the clinical literature Assigning windows to training and test sets at random, so that windows from the same person and the same recording block fall on both sides. Excludes any split that keeps all of one person's data on one side. full definition: the windows are assigned to training and test sets at random, so windows from the same person and the same recording block fall on both sides. The windows are usually overlapping windowsDefinition: overlapping windows signal processing Fixed-length stretches cut from a recording at a step shorter than their length, so that neighbouring windows share samples. Here 60 s windows every 15 s share 75 percent of their samples. Excludes windows cut end to end with no shared samples. full definition, fixed-length stretches cut at a step shorter than their length. Here a 60 s window is cut every 15 s, so neighbours share 75 percent of their samples.
The clinical machine-learning literature has argued over this choice. Saeb and colleagues [2] showed on wearable and phone sensor data that record-wise and subject-wise cross-validation can give very different error rates, and traced the gap to the classifier learning to recognise people. Little and colleagues [3] replied that subject-wise splits can also mislead in some settings. Chaibub Neto and colleagues [4] built a permutation test for identity confounding and, on mobile health data, found strong evidence of it under record-wise splits. Our searches on 9 November 2026 also returned recent WESAD studies and open audits that make the same point about random splits; we read those at the level of search summaries and do not cite their numbers.
This paper adds a known answer. We build data in which nothing can carry from one person to another, run it through the same windows, features and models as the real data, and measure what the random split reports. Then we ask three questions of the real data: whether the classifier holds for a person it has not seen, which sensors carry the signal, and whether the size of a person's bodily response follows the size of the stress they report. On the last question, Campbell and Ehlert [5] reviewed acute psychosocial stress studies and asked whether emotional and physiological responses correspond.
Preregistration and design
The design was written as a preregistrationDefinition: preregistration research method (metascience) A dated written plan for a study, fixed and hash-locked before any result is seen: the question, the data, the statistic, the controls, the forecasts and the kill conditions. Excludes a plan revised after looking at the outcome, and a protocol written only for the record after the run. full definition, a dated plan fixed and hash-locked before any result is seen, on 31 October 2026 at 22:37 UTC. Window features were extracted and fixed before any label was compared with them. The decision it informs was stated in the file: how much to discount a wearable stress classifier reported under a within-person random split, and whether its label reads stress or a protocol.
The locked file names the data, the windows and features, four splits, two models, the sensor groups, the felt-stress test, a planted checkDefinition: planted check research method; called a positive control in experimental science Data built so that the right answer is known, run through the same analysis before the real data, to show that the analysis can see the effect when it is there. Excludes any check made on the real data, which cannot show what the analysis misses. full definition (data built so the right answer is known, run before the real data), a controlDefinition: control statistics and experimental design A version of the data with the structure under test removed (for example shuffled or pooled), scored the same way as the real data, so the real score has something to beat. Excludes a comparison with a different dataset or with a published number. full definition (a version of the data with the structure under test removed), forecasts and kill conditionsDefinition: kill condition research method (our usage, after Popper's falsification) A rule written in the preregistration that, when met, decides against the claim with no room for judgement after the run. Excludes reasons found after the run for setting a result aside. full definition, rules that decide against the claim with no room for judgement after the run.
Kill conditions, without discretion:
- If the planted data with nothing to learn fail (random split under 0.8 or held-out person above 0.6), or if the planted data with a real shared shift score under 0.9 for a held-out person, the instrument gets no claim.
- A leakage claim requires the random forest's random-split AUC to exceed its held-out-person AUC by at least 0.02.
The first run met the second part of the first rule: the planted shift scored 0.824 against a bar of 0.90. By its own rule that run was voidDefinition: void research method (our usage) The verdict of a run whose planted check failed or whose sample fell below its stated minimum. It says nothing for or against the claim. Excludes a null result, which comes from a working instrument. full definition, a verdict that says nothing for or against the claim. A calculation after the run showed the bar left almost no room: for the planted shift of 2 the best possible AUC is about 0.91 (section Methods). A second preregistration, locked at 22:39 UTC the same evening, kept the real-data handling unchanged, tested planted shifts of 2, 3 and 4 on a fresh seed, and required the shift of 4 to reach 0.90 for a held-out person. If it passed, the first run's real-data results were to be credited. It passed. The second plan was written after the first run's results were seen, and its forecasts for the real data copy the first run's values; we report it as a repair, not as a blind test.
Data and provenance
The data are WESAD [1], obtained from the authors' page at the University of Siegen; the UCI repository record (doi:10.24432/C57K5T) points to that page. The terms allow scientific, non-commercial use with credit to the dataset's owners. This paper reports statistics only. Subjects are pseudonymous (S2 to S17; there is no S1 or S12); no attempt was made to identify anyone.
We used the chest device only, recorded at 700 Hz, read from the text files: ECG, EDA, EMG, skin temperature, three-axis acceleration and respiration. The pickled files were not opened. Condition times and the questionnaire answers came from each person's questionnaire file. The task was the binary one of the dataset paper: stress (the Trier test) against baseline and amusement. Windows of 60 s were cut every 15 s inside each condition. Windows with any missing feature were dropped, leaving 2,122 windows from 15 people, 30 percent of them stress.
Electrodermal activity (EDA)Definition: electrodermal activity (EDA) psychophysiology The electrical conductance of the skin, which rises with sweat gland activity under sympathetic nervous control. Excludes a direct reading of emotion; temperature and movement also change it. full definition, used throughout, is the electrical conductance of the skin, which rises with sweat gland activity under sympathetic control.
Methods
Features
Twenty features in six groups were computed per window. ECG: heart rate, the standard deviation of beat intervals, the root mean square of successive interval differences, and the ratio of the two as a rough balance measure. EDA: mean, standard deviation, slope and the count of skin conductance responses. Temperature: mean and slope. Respiration: breath count, amplitude and standard deviation. Acceleration: mean magnitude, its standard deviation and the mean of each axis. EMG: root mean square and 90th percentile of the rectified signal.
Models and score
Two classifiers were scored. A random forestDefinition: random forest machine learning A classifier that averages many decision trees, each grown on a resampled copy of the training data with a random subset of features tried at each split. Here 100 trees with at least 3 windows per leaf. Excludes any model tuned on the test person. full definition averages 100 decision trees grown on resampled data with at least 3 windows per leaf. Logistic regressionDefinition: logistic regression statistics A classifier that models the log odds of the positive class as a weighted sum of the features. Here on standardised features with an L2 (ridge) penalty at strength C = 1. Excludes interactions between features, which it does not model unless they are added by hand. full definition models the log odds of stress as a weighted sum of standardised features. The score is the AUCDefinition: AUC (area under the ROC curve) statistics and machine learning The probability that a classifier gives a randomly chosen positive case a higher score than a randomly chosen negative case. 0.5 is chance and 1 is perfect separation. Excludes accuracy at one threshold, and any statement about how well the scores are calibrated as probabilities. full definition, the probability that a randomly chosen stress window gets a higher score than a randomly chosen non-stress window. With ranks of the scores, stress windows and others,
where is the sum of the stress windows' ranks. AUC is reported two ways: global, over all held-out windows pooled, and within-person AUCDefinition: within-person AUC machine learning evaluation, our usage The AUC computed on one held-out person's windows alone, then averaged over people. It asks whether the classifier ranks that person's stress windows above their other windows. Excludes the global AUC, which pools all held-out windows and also rewards separating people from each other. full definition, computed on each person's windows and then averaged over people.
Splits
- Random split over windows: five folds assigned at random to windows.
- Time blocks within a person: in each person's condition block, windows before the block's middle train and windows after it test, with a guard of 37.5 s on each side of the middle so that no test window overlaps a training window.
- Held-out personDefinition: held-out person (leave one subject out) machine learning evaluation; called subject-wise cross-validation Training on all people but one and scoring on the one left out, repeated so that each person is held out once. Excludes a test on people from another study, lab or protocol. full definition: train on 14 people, score the fifteenth, once for each person.
- Held-out person with each person's features scaled to that person's own baseline mean and standard deviation.
The leakage gap is the difference between the random-split and held-out-person global AUCs:
Planted data
The planted data keep the real windows' people, conditions and timing and replace the features. For window of person in condition block , feature is
where and are independent standard normal draws, the second shared by every window of one person's block, is 1 for a stress window and 0 otherwise, and is a planted shared shiftDefinition: planted shared shift research method, our usage A fixed amount added to one feature in every stress window of every person in planted data, in the same direction for all, so that a classifier tested on a new person has something real to find. Excludes the per-person, per-block offsets, which point in a random direction and carry nothing from one person to the next. full definition added to the first feature only. With each block has its own offsets in a random direction and nothing carries from one person to the next; a held-out person should score near 0.5. With a held-out person has something real to find.
For one feature, the stress and non-stress values each have variance , so the ceiling AUC for a shiftDefinition: ceiling AUC for a shift statistics, our derivation The AUC a perfect reader of the one shifted feature could reach when the stress and non-stress values of that feature are normal with a variance of 1.09 each (a block offset of variance 1 plus window noise of variance 0.09). Excludes the effect of the 19 features that carry no shift, and of the small number of people. full definition is
where is the standard normal cumulative distribution. At this gives 0.912, which is why a bar of 0.90 left no room.
Sensor groups
Each sensor group, physiology without motion or breath (ECG, EDA and temperature) and motion alone (acceleration and EMG) were scored by held-out-person within-person AUC with the random forest. Whether each of the six single groups beats chance was tested with logistic regression against 100 block permutations, in which each person's stress label is moved to one of their condition blocks chosen at random, so block structure and the share of stress windows stay. The p value counts permutations at or above the real score, with one added to both counts:
The six p values were adjusted with the Benjamini-Hochberg correctionDefinition: Benjamini-Hochberg correction statistics, multiple testing A rule that adjusts a set of p values so that, among the tests called significant, the expected share of false discoveries stays at or below a chosen level q. Excludes control of the chance of even one false discovery, which is a stricter rule. full definition, which keeps the expected share of false discoveries among the tests called significant at or below q 0.05. For p values sorted in increasing order, the th of is scaled to , and each adjusted value is the smallest scaled value at or after its place in the order.
Felt stress
For each person, the change in the six-item STAIDefinition: STAI, six-item form psychology A short form of the State-Trait Anxiety Inventory in which a person rates six statements about how they feel at that moment. Positive items are reverse scored so that a higher total means more anxiety. Excludes a clinical diagnosis, and anxiety as a lasting trait. full definition total, a short state-anxiety questionnaire in which positive items are reverse scored, was taken from baseline to stress. The same person's change in mean EDA, heart rate and breath count from baseline windows to stress windows was compared with it across the 15 people by Spearman rhoDefinition: Spearman rho statistics The correlation between the ranks of two quantities. It runs from -1 to 1 and measures how well one quantity's order follows the other's, whatever the shape of the relation. Excludes the size of the change, and any causal direction. full definition, the correlation of ranks.
Interval on the within-person mean
The second run reports a 95% intervalDefinition: 95% interval statistics The range that holds the middle 95 percent of the bootstrap or control draws for a number. We report it beside the number. Excludes a statement that the true value lies inside with 95 percent probability. full definition on the mean within-person AUC by bootstrap by personDefinition: bootstrap by person statistics, resampling Redrawing people with replacement, 2,000 times, and recomputing the mean of the per-person scores each time. The middle 95 percent of those means is the interval. Excludes redrawing single windows, which would treat one person's many windows as many independent people. full definition: people are redrawn with replacement 2,000 times and the mean is recomputed each time.
Controls and planted checks
Planted data with nothing to learn () were run in both runs. The random split read 1.000 (first run, 0.99999 before rounding) and 1.000 (second run). The held-out-person split read 0.469 and 0.391. Both passed their rules.
- data2,122 windows, 15 peopleWESAD chest recordings cut into windows. 30 percent are stress windows.
- measurementRandom split over windowsWindows from one person land in both the training and the test set.
- measurementHeld-out-person splitEach person is tested by a model trained only on the other people.
- planted checkPlanted: nothing to learnEach block gets its own offset and the label carries no shared signal. Random split 1.000, held-out person 0.469.
- controlControl: block shuffleThe stress label moves to a random condition block in each person, 100 draws. 95th percentile 0.656.
- rule set in advanceRule: gap of at least 0.02The random split must read at least 0.02 above the held-out-person split for the forest. Set before any label was compared.
- leak shownGap 0.033Real data, random forest: 1.000 random, 0.966 held-out person.
Read from result.json (first run), run 20261031T223719Z. SHA-256 of the run's file 65165c7a7ae8e10e608678e849959846e47f195c143fcb9db6665e22021d8296 and of the published copy ac1b2ae3a1ecd20a3442fab03f9d3671d196cc51cfc170c758ac5995f73106b6. In the copy, file paths are cut to the file name and the layout (indentation, line endings) may differ; every value is the same.
The planted shift failed in the first run, at 0.824 against the bar of 0.90 for . In the second run, on a fresh seed, the forest reached 0.692 at (ceiling 0.912), 0.987 at (ceiling 0.979) and 0.994 at (ceiling 0.997). The rule on the shift of 4 passed. The value at sits 0.008 above its computed ceiling; the ceiling counts one feature and two normal distributions, and we did not trace the difference. The two runs at differ by 0.13, so this planted check is noisy at small shifts.
The block-shuffle control moves each person's stress label onto one of their own condition blocks at random and scores logistic regression on held-out people. Over 100 draws in the first run it gave a mean of 0.487 and a 95th percentile of 0.656 (p from drawsDefinition: p value (from draws) statistics The share of control draws scoring at or above the real score, with one added to the count and to the number of draws, so it is never zero. Excludes a p value from a textbook formula that assumes a distribution. full definition 0.0099); over 40 draws in the second it gave 0.472 and 0.594 (p 0.024). The real logistic score of 0.896 clears both. This control's 95th percentile marks the top of its null distributionDefinition: null distribution statistics The spread of scores a control gives over many random draws. Its 95th percentile is the bar a real score must clear. Excludes a theoretical distribution assumed rather than drawn from the data. full definition, the spread of scores the control gives over random draws.
Results
What the random split reports
A random split over windows scored an AUC of 1.000 and a held-out-person split scored 0.469. That is the planted data with nothing to learn, in the first run. The random forest separated stress from non-stress windows perfectly by recognising each block's offsets in windows it had already seen. Figure 1 sets these planted values beside the real ones.
AUC (0.5 is chance, 1 is perfect)
- random split over windows
- held-out person
- chance, 0.5
Data behind chart 2 7 rows
| Model and data | Random split | Held-out person | Gap |
|---|---|---|---|
| Forest on planted data with nothing to learn | 1.000 | 0.469 | 0.531 |
| Random forest, real recordings | 1.000 | 0.966 | 0.033 |
| Logistic regression, real recordings | 0.982 | 0.896 | 0.086 |
| Random forest, time blocks within a person | 0.982 | ||
| Logistic regression, time blocks within a person | 0.965 | ||
| Random forest, held-out person scaled to own baseline | 0.964 | ||
| Logistic regression, held-out person scaled to own baseline | 0.971 |
Read from result.json (first run), run 20261031T223719Z. SHA-256 of the run's file 65165c7a7ae8e10e608678e849959846e47f195c143fcb9db6665e22021d8296 and of the published copy ac1b2ae3a1ecd20a3442fab03f9d3671d196cc51cfc170c758ac5995f73106b6. In the copy, file paths are cut to the file name and the layout (indentation, line endings) may differ; every value is the same.
The real recordings
Table 1 gives both models under the four splits. The random forest held across people at a held-out-person AUC of 0.966, against 1.000 under the random split. The second run, on a new seed, gave 0.999 and 0.966. The random split inflated the AUC by 0.033 for the random forest and 0.086 for logistic regression. Scaling each person to their own baseline brought the logistic score from 0.896 to 0.971 and left the forest at 0.964.
random forest, AUC for this person
logistic regression, AUC for this person
- equal under both models
Data behind chart 3 16 rows
| Person | Random forest | Logistic regression |
|---|---|---|
| S2 | 0.912 | 0.907 |
| S3 | 0.996 | 0.886 |
| S4 | 0.993 | 0.998 |
| S5 | 1.000 | 1.000 |
| S6 | 1.000 | 1.000 |
| S7 | 1.000 | 1.000 |
| S8 | 1.000 | 0.982 |
| S9 | 0.917 | 0.941 |
| S10 | 0.923 | 0.944 |
| S11 | 1.000 | 1.000 |
| S13 | 0.990 | 0.986 |
| S14 | 1.000 | 1.000 |
| S15 | 0.990 | 0.646 |
| S16 | 1.000 | 0.999 |
| S17 | 0.958 | 0.994 |
| Mean over people | 0.979 | 0.952 |
Read from result.json (first run), run 20261031T223719Z. SHA-256 of the run's file 65165c7a7ae8e10e608678e849959846e47f195c143fcb9db6665e22021d8296 and of the published copy ac1b2ae3a1ecd20a3442fab03f9d3671d196cc51cfc170c758ac5995f73106b6. In the copy, file paths are cut to the file name and the layout (indentation, line endings) may differ; every value is the same.
Read from result.json (second run), run 20261031T223929Z. SHA-256 of the run's file 142aab473f4fbe40d2680a617c33962bf7ff717915b811b45f3b9cbdc5db6aae and of the published copy 1c2d67ec3cc4a9b772cd1f3a662b086040d7194d806a5d8338810cbc3fcf0a73. In the copy, file paths are cut to the file name and the layout (indentation, line endings) may differ; every value is the same.
The mean within-person AUC for a held-out person was 0.979, with a 95% interval of 0.961 to 0.994 by bootstrap over people. The worst person under the forest read 0.912 (S2); under logistic regression the worst read 0.646 (S15). Figure 2 shows every person and the planted-shift check.
Which sensors carry it
By sensor group, held-out person, random forest, the within-person AUCs were ECG 0.92, EDA 0.89, respiration 0.85, acceleration 0.82, temperature 0.60 and EMG 0.45 (Figure 3). In the logistic permutation test five groups passed the correction at q 0.012 each; EMG did not (q 0.33). ECG, EDA and skin temperature together reached 0.97 for a held-out person, and acceleration with EMG reached 0.79. The Trier test has people stand and speak, so posture and breath move with the label. The classifier does not need them: physiology without motion or breath carries more than motion does.
Felt stress against bodily change
The six-item STAI rose by 7.7 points on average from baseline to stress, so people reported feeling the test. Across the 15 people, the rise in reported anxiety did not follow the size of the bodily change: Spearman rho 0.03 with EDA, 0.02 with heart rate and -0.45 with breathing rate (p 0.09). The p values for EDA and heart rate were 0.93 each. With 15 people, a correlation's interval is wide, so this result rules out only a strong relation.
Forecasts against outcomes
Table 2 sets the forecasts in the first preregistration against the outcomes. The forecast that motion would carry more than physiology, given probability 0.6, was wrong.
Discussion
The planted result is the general one. It needs no stress physiology: any dataset of overlapping windows with person or block structure will let a random split score the recording rather than the state. The argument between Saeb and colleagues [2] and Little and colleagues [3] was over which split estimates the error that matters. A known-answer test settles a narrower point for this design: when the planted answer is "nothing generalises", the random split says "perfect".
On the real data the inflation was small for the forest (0.033) and larger for logistic regression (0.086). Logistic regression gains the most from scaling each person to their own baseline, which suggests the gap for that model comes from differences in each person's resting level; we did not test that reading separately. The classifier does hold for new people inside this sample, which agrees with the dataset paper's held-out results [1].
The felt-stress result points the same way as the question Campbell and Ehlert [5] put: people reported more anxiety and their bodies changed, but across people the size of the reported rise did not track the size of the bodily change at any strength this sample could detect. A classifier trained on bodily signals reads the laboratory hour; it does not read how much that hour cost a given person.
Limitations
- Fifteen people, one laboratory, one protocol, about one hour each. A held-out person is a stranger only inside this sample.
- The stress session tends to follow baseline in time, so order is confounded with condition. A cardiac signal also carries posture and speech.
- With 15 people, the interval on any felt-stress correlation is about plus or minus 0.5. "Did not follow" means no relation of that size was detected.
- The first run's planted check failed through our own careless bar. The repair was written after seeing that failure, on a new seed, and its real-data forecasts copy the first run.
- The planted check at a shift of 2 gave 0.824 and 0.692 in the two runs, so it is noisy at small shifts.
- Nothing here reaches daily stress, chronic stress or trauma, and the classifier says nothing about what the hour meant to anyone.
- Features and models were fixed by us and not tuned; scoring was by our own code and was not blind.
Evidence
Held. Open data with planted checks and controls; a small sample and one protocol. Planted data with nothing to learn give a clean known answer on leakage. The planted shared shift failed in the first run and passed in a second run at a larger shift.
Figures
These are the paper's own figures, numbered as in the PDF, and each "Figure" reference in the text points here. The charts on this page redraw the same results from the result files and carry their own numbers.
Tables
| Split | Forest, global | Logistic, global | Forest, within-person |
|---|---|---|---|
| Random over windows | 1.000 | 0.982 | 1.000 |
| Time blocks within a person | 0.982 | 0.965 | 0.980 |
| Held-out person | 0.966 | 0.896 | 0.979 |
| Held-out person, own baseline | 0.964 | 0.971 | 0.979 |
| Quantity | Forecast | Outcome |
|---|---|---|
| Forest, random split | 0.999 | 1.000 |
| Forest, time blocks | 0.97 | 0.982 |
| Forest, held-out person | 0.95 | 0.966 |
| Forest, held-out person, own baseline | 0.97 | 0.964 |
| Logistic, held-out person | 0.94 | 0.896 |
| Random-split gap, forest | 0.05 | 0.033 |
| ECG, EDA, temperature, respiration | 0.82, 0.80, 0.65, 0.85 | 0.92, 0.89, 0.60, 0.85 |
| Acceleration, EMG | 0.90, 0.75 | 0.82, 0.45 |
| Physiology without motion; motion only | 0.90; 0.92 | 0.97; 0.79 |
| Planted, nothing to learn: random; held-out | 0.95; 0.50 | 1.000; 0.469 |
| Planted shift of 2, held-out person | 0.98 | 0.824 |
| Block-shuffle control mean | 0.50 | 0.487 |
| Felt-stress correlations | 0.2, none significant | 0.03, 0.02, -0.45; none significant |
| Groups passing correction | 5 of 6 | 5 of 6 |
Appendix A. The preregistered verdicts
Each verdictDefinition: verdict research method (our usage) The pass or fail of one preregistered rule set against the run's numbers, read off by code. Excludes an interpretation written after reading the numbers. full definition is a set of rules written before the run, read off by code. A verdict passes only when every rule holds. Values are read from the two result files.
| Verdict | Deciding rule | Value | Holds |
|---|---|---|---|
| First run: planted, nothing to learn, random | random-split AUC at least 0.8 | 1.000 | yes |
| First run: planted, nothing to learn, held out | held-out-person AUC at most 0.6 | 0.469 | yes |
| First run: planted shift | shift of 2, held-out-person AUC at least 0.9 | 0.824 | no |
| First run: leakage | forest gap at least 0.02 | 0.033 | yes |
| First run: control | logistic held-out AUC above the block-shuffle 95th percentile (0.656) | 0.896 | yes |
| First run: physiology above motion | physiology-only AUC above motion-only AUC (0.786) | 0.970 | yes |
| Second run: planted shift | shift of 4, held-out-person AUC at least 0.9 | 0.994 | yes |
| Second run: planted, nothing to learn, random | random-split AUC at least 0.8 | 1.000 | yes |
| Second run: planted, nothing to learn, held out | held-out-person AUC at most 0.6 | 0.391 | yes |
| Second run: leakage | forest gap at least 0.02 | 0.033 | yes |
| Second run: control | logistic held-out AUC above the block-shuffle 95th percentile (0.594) | 0.896 | yes |
What lowers it
- scoring Scored by code and by the agent that ran it; self-graded. from our publication register, on who scored it
- blinding Not blind, as the paper's limitations state. from the paper's Limitations
- depth of reading The cited literature was read at the level of abstracts and search summaries, except Campbell and Ehlert, whose abstract was read during the study on 31 October 2026; full texts were not read. from the Verified section
What holds it up
- preregistration Preregistered and hash-locked before the run (sha256 9263e28c). from the Reproduce section
Where the claim stands
- lead
- hypothesis
- thesis
- conjecture
- theorem
- law candidate
- killed
A preregistration with pass-or-fail rules is on file, which this rung needs. The next rung needs a named rival reading beaten by a decisive observation, and none is on file. Tier B: Open data with planted checks and controls; a small sample and one protocol. Planted data with nothing to learn give a clean known answer on leakage. The planted shared shift failed in the first run and passed in a second run at a larger shift.
Trail
Versions
- v3 2026-11-14, this page corrected, 1 item; the PDF and its BuildTeX source are still paper version 1.0
- v2 2026-11-09, paper version 1.0, first published PDF sha256 d26e7ed246f32325
- v1 2026-10-31, entered in the findings ledger
Corrections
2026-11-14 scope found by a review of the published pages
A review of the published page found the first run's failed planted check described as a bar above the ceiling. now The bar was 0.90 and the ceiling for a planted shift of 2 is 0.912, so the bar sat just under the ceiling; the run scored 0.824, and the second run scored 0.692 at the same shift. The abstract, the design section and the earlier correction note now give those numbers. The first diagram said chest and wrist recordings; only the chest device was used, and it now says so.
2026-10-31 wording found by a review of our findings ledger
A review of our ledger recorded the entry as self-graded and not blind, with order confounded with condition. now Both are stated in the limitations.
2026-10-31 wording found by the study itself, before publication
The first run's planted check failed against a bar of 0.90 that sat just under the ceiling of about 0.91 for a shift of 2. now A second preregistered run repaired the plant. Both runs are reported.
Standing, and the ledger entries it rests on
2026-10-31 narrowed in part F422
Set by hand from findings ledger entry F422, dated 2026-10-31: planted check and scoring. Rests on findings ledger, F422 correction pass.
Each correction is a dated note; the findings ledger is never rewritten, and a note governs where it differs.
Ledger and version dates up to publication are local dates in US Pacific time. Clock times in the text are UTC, seven or eight hours ahead, so a lock or a run stamped just after midnight UTC belongs to the previous local day. Corrections from 14 November 2026 on are dated in UTC.
References
- Schmidt, P., Reiss, A., Duerichen, R., Marberger, C. and Van Laerhoven, K. (2018). Introducing WESAD, a multimodal dataset for wearable stress and affect detection. Proceedings of the 20th ACM International Conference on Multimodal Interaction (ICMI 2018). doi:10.1145/3242969.3242985. Data: UCI Machine Learning Repository, doi:10.24432/C57K5T; scientific non-commercial use with credit. run here Licence: as stated in the paper's data section used in Introduction, Data and provenance, Discussion
- Saeb, S. and others (2017). The need to approximate the use-case in clinical machine learning. GigaScience 6(5). abstract or summary, 2026-11-09: abstracts and search summaries, except Campbell and Ehlert, whose abstract was read during the study on 31 October 2026; full text not read used in Introduction, Discussion
- Little, M. A. and others (2017). Using and understanding cross-validation strategies. Perspectives on Saeb et al. GigaScience 6(5). doi:10.1093/gigascience/gix020 abstract or summary, 2026-11-09: abstracts and search summaries, except Campbell and Ehlert, whose abstract was read during the study on 31 October 2026; full text not read used in Introduction, Discussion
- Chaibub Neto, E. and others (2019). Detecting the impact of subject characteristics on machine learning-based diagnostic applications. npj Digital Medicine. doi:10.1038/s41746-019-0178-x. Preprint arXiv:1712.03120. abstract or summary, 2026-11-09: abstracts and search summaries, except Campbell and Ehlert, whose abstract was read during the study on 31 October 2026; full text not read used in Introduction
- Campbell, J. and Ehlert, U. (2012). Acute psychosocial stress: does the emotional stress response correspond with physiological responses? Psychoneuroendocrinology. doi:10.1016/j.psyneuen.2011.12.010 abstract or summary, 2026-11-09: abstracts and search summaries, except Campbell and Ehlert, whose abstract was read during the study on 31 October 2026; full text not read used in Introduction, Discussion
Cited by later findings
- F422 narrowed in part, planted check and scoring, 2026-10-31 (record findings ledger, F422 correction pass). A later review of our ledger recorded a failed planted check and an error: the first planted check failed, and the entry was self-graded and not blind, with order confounded with condition.
Reproduce
Data
- Schmidt 2018. Licence: as stated in the paper's data section. https://doi.org/10.1145/3242969.3242985
Preregistration
sha256 9263e28c14233905170468307af9706b5751c407f01bbb7d15ff253c4e6760c5
plan 98c0135c808b80cb0bb6bd7222184b1868739ac0f6d2cf1626b2b954c17484d6
Steps
- Data: request WESAD from its authors under their non-commercial terms. Use the chest recordings and the questionnaire files.
- Cut the baseline, amusement and stress conditions into 60 s windows with a 15 s step and compute the twenty features of section Methods. Drop windows with a missing feature.
- Score a random forest (100 trees, at least 3 per leaf) and a logistic regression on standardised features by AUC, eq. 1, under the four splits, and compute the gap, eq. 2.
- Build planted data with eq. 3 at shifts of 0, 2, 3 and 4 and check that a random split reads high and a held-out person near 0.5 at a shift of 0.
- Run the block-shuffle control and the sensor-group permutations, adjust with Benjamini-Hochberg, and compute the felt-stress Spearman correlations.
- First run: preregistration SHA-256 9263e28c14233905170468307af9706b5751c407f01bbb7d15ff253c4e6760c5. Plan SHA-256 98c0135c808b80cb0bb6bd7222184b1868739ac0f6d2cf1626b2b954c17484d6. Run 20261031T223719Z. Result SHA-256 65165c7a7ae8e10e608678e849959846e47f195c143fcb9db6665e22021d8296.
- Second run: preregistration SHA-256 5f1b6cda094184677b55ab08c84f05613e04f30f8c3a5484ec725a2b18b545c2. Plan SHA-256 5b45f5620a043beb623d96d6427e3b2e3024aeacef4ceb867f96e2164e9d6fa1. Run 20261031T223929Z. Result SHA-256 142aab473f4fbe40d2680a617c33962bf7ff717915b811b45f3b9cbdc5db6aae.
Cost. The analysis and control took about 100 s in the first run and 31 s in the second on one desktop CPU, after feature extraction. The study was not re-run for this paper.
Downloads
- Whitepaper, PDF F320.pdf, 601 KB
- BuildTeX source F320.bld, 40 KB
- Build receipt F320.buildtex.json, 1 KB
- BuildLang doc module doc.bld, 5 KB, imported by the source
The PDF is typeset by BuildTeX from F320.bld, which is written from the same source as this page. The receipt records the source's SHA-256 and the PDF's (d26e7ed246f3), so anyone can rebuild it and compare. The copy here has its hidden author field blanked, as the site does for every file it publishes; blank the same field in a rebuild before comparing. The name stays on the first page.
Verified
Verified on 2026-11-09. On 9 November 2026 the 2,122 windows and 15 people, the stress share, every AUC in Tables 1 and 2, the two gaps, the within-person mean and its interval, each person's AUC, the per-sensor AUCs and their corrected q values, the planted values in both runs and their ceilings, both block-shuffle controls and the felt-stress correlations were re-read from the two runs' result files. They match the findings ledgerDefinition: findings ledger our records The append-only, dated list of every result we have recorded, numbered F1, F2 and on. Corrections are added as new dated lines and old entries are never rewritten. Excludes a curated list of successes. full definition, the dated append-only list of our results. Both preregistration SHA-256 values match those recorded in the result files, and the result files' leading hashes match the ledger. All three figures were drawn by a script that reads only the two result files.
Not checked. The study was not re-run for this paper. The cited papers were found by searches run on 9 November 2026 and read at the level of abstracts and search summaries, except Campbell and Ehlert, whose abstract was read during the study on 31 October 2026; Saeb and colleagues' paper was known through the two replies and the search summary, and its full text was not read.
Terms on this page
Each term is defined where it is first used on this page. Each name below opens its entry in the findings glossary, which lists every page that uses it.
- Trier Social Stress Test psychology and psychoneuroendocrinology first use
- random split over windows machine learning evaluation; called record-wise cross-validation in the clinical literature first use
- overlapping windows signal processing first use
- preregistration research method (metascience) first use
- planted check research method; called a positive control in experimental science first use
- control statistics and experimental design first use
- kill condition research method (our usage, after Popper's falsification) first use
- void research method (our usage) first use
- electrodermal activity (EDA) psychophysiology first use
- random forest machine learning first use
- logistic regression statistics first use
- AUC (area under the ROC curve) statistics and machine learning first use
- within-person AUC machine learning evaluation, our usage first use
- held-out person (leave one subject out) machine learning evaluation; called subject-wise cross-validation first use
- planted shared shift research method, our usage first use
- ceiling AUC for a shift statistics, our derivation first use
- Benjamini-Hochberg correction statistics, multiple testing first use
- STAI, six-item form psychology first use
- Spearman rho statistics first use
- 95% interval statistics first use
- bootstrap by person statistics, resampling first use
- p value (from draws) statistics first use
- null distribution statistics first use
- verdict research method (our usage) first use
- findings ledger our records first use
To report an error, name the finding, the claim number and the source on the Work page, which gives the address. Accepted corrections join the Trail with their date.