
Findings F23 Plants, trees and earth, Biology and medicine found 2026-10-29
Fungal hub trees mostly track sampling, cedar heartwood rots slowest, wind damage evades prediction
In a public map of fungi shared between Douglas-fir roots, the hub trees are largely what the sampling and the number of links produce. In a 30-year log experiment, western redcedar heartwood lost density slowest of four species, and in a large forest inventory, wind damage ranked well but forecast almost nothing.
- Tier
- B, signal
- Outcome
- held
- Rung
- hypothesis
- Corrections
- 2, latest 2026-11-09
- Version
- v2, 2026-11-09
- Redo it
- Reproduce
Download PDF 643 KB BuildTeX source F23.bld
What this means for a reader
The picture of a forest wired to large "mother trees" needs a comparison before it carries meaning. In the one public map we tested, the hub pattern is what you get from how many root tips were dug up on each tree and how many links each tree has, with nothing extra left for hubs to explain. A shared fungus also shows only that one fungal individual reached two root systems; whether anything passed between them is a separate question these data cannot answer. Cedar's reputation holds for its heartwood and not for its sapwood. Wind damage in inventory records is too rare for a model to say which tree will break, though it can say which trees to look at first.
Objection
The network sample is small: 26 trees had a measured diameter, in one forest type and one region, sampled once. Plots of 13 to 41 trees cannot establish or exclude a power-law tail.
What would change the call. Apply the same nulls to Beiler 2010 and other mapped networks, with a model that separates root extent from effort.
From the paper's first stated limitation; our register records no separate objection.
Abstract
Three popular forest claims were tested on public data with rules fixed in advance. The first is that large trees act as hubs in fungal networks below ground. In a mapped network of 166 Douglas-fir trees and 56 Rhizopogon fungal individuals in six plots, bigger trees carried more fungal partners (Spearman rho 0.45, 26 trees), but the number of root tips sampled per tree tracked partners at rho 0.87. Once sampling was controlled, the size link fell to a partial rho of 0.20 (p 0.067), and hub concentration and nestedness sat inside 1,000 degree-preserving shuffles in 6 of 6 plots. The second claim is that western redcedar decays slowly. In the 530-log HJ Andrews experiment, cedar heartwood lost density at 0.0026 per year (95% interval 0.0016 to 0.0038), the slowest of four species, while cedar sapwood ranked third of four. The third is that inventory data can say which trees wind will damage. Among 488,499 live trees in Washington and Oregon, 506 (0.10 percent) carried recorded wind damage; a model ranked risk with a held-out AUC of 0.77 but gained a Brier skill of only 0.0014 over the base rate. Bigger, more slender and recently cut trees were not more damaged, against our forecasts.
c1 observed, evidence for claim 1
- The numbers in claim 1
- 0.20; 0.067; 1,000; 6 matches the result file, 2026-11-09
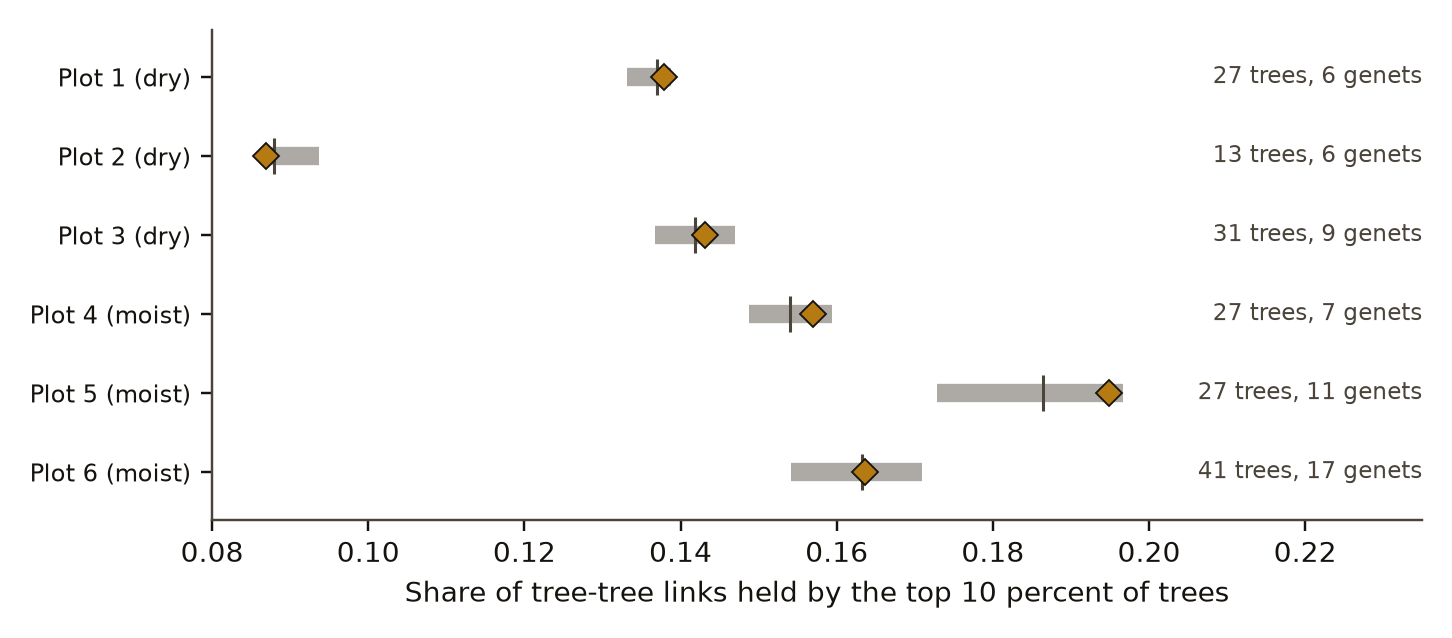
- Chart 1
- Share of tree-to-tree links held by the best-connected tenth of trees, against shuffled networks.
- Chart 2
- Nestedness of each plot's network, against shuffled networks.
- Basis
- observed: measured in this study, with a result file
c2 observed, evidence for claim 2
- The numbers in claim 2
- 530; 0.0026; 95; 0.0016; 0.0038 matches the result file, 2026-11-09
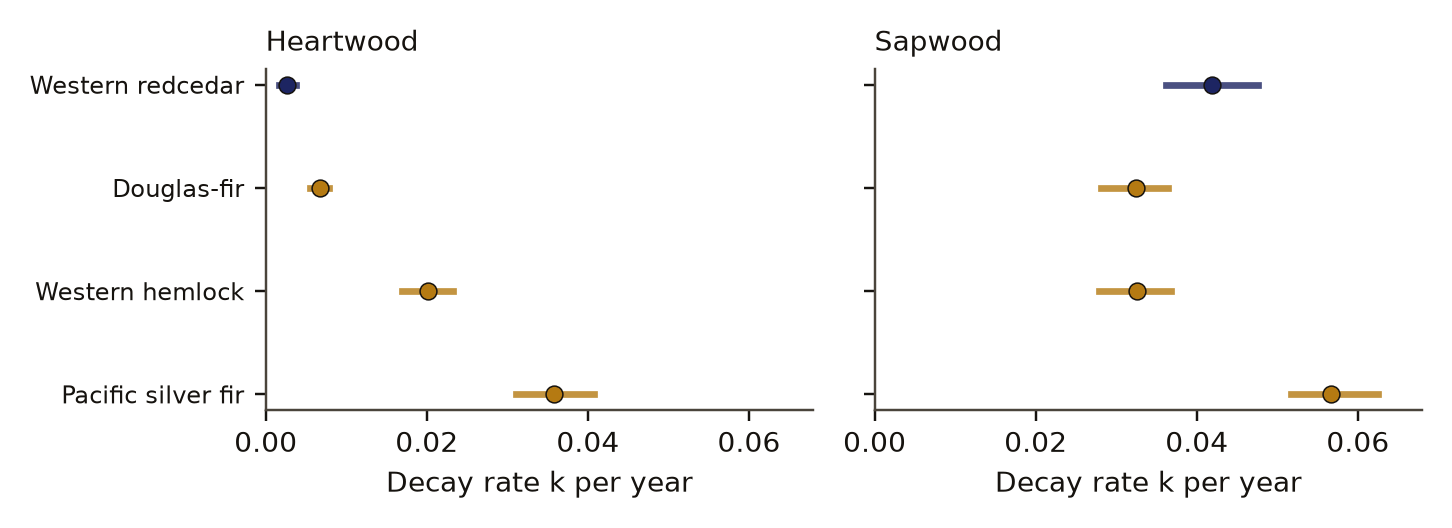
- Chart 3
- Yearly density loss of logs by species, for heartwood and for sapwood.
- Basis
- observed: measured in this study, with a result file
c3 observed, evidence for claim 3
- The numbers in claim 3
- 488,499; 506; 0.10; 0.77; 0.0014 matches the result file, 2026-11-09
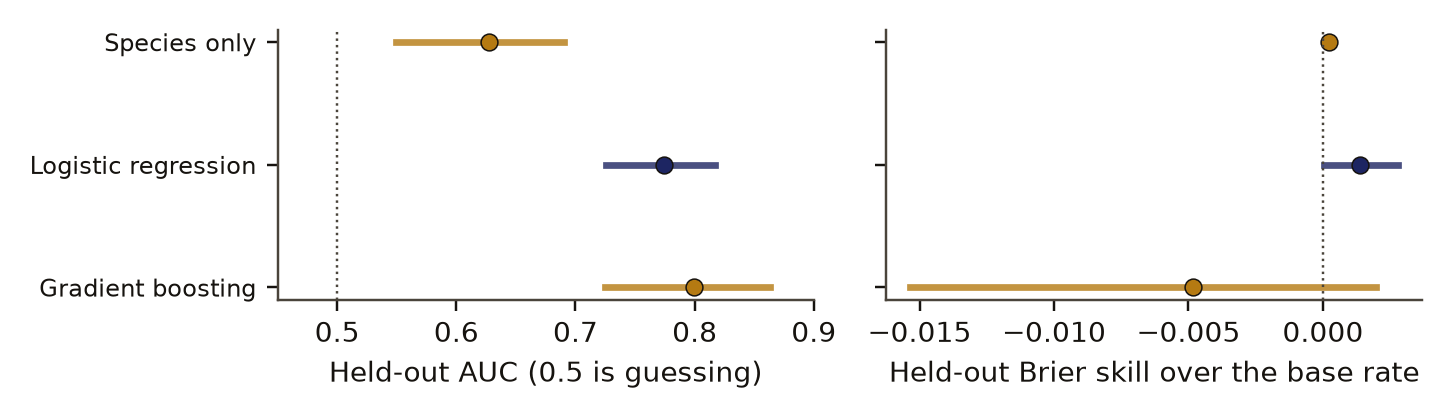
- Chart 4
- How well each model ranks held-out trees by wind-damage risk.
- Chart 5
- How much each model improves the stated probabilities over the base rate.
- Basis
- observed: measured in this study, with a result file
Introduction
A mycorrhizaDefinition: mycorrhiza mycology and plant ecology A root tip of a plant enclosed by a fungus that lives with it, the fungus taking sugars from the plant and passing it water and soil nutrients. Here the tuberculate root tips that Rhizopogon fungi form on Douglas-fir. Excludes fungi that rot wood or cause disease, and fungal threads in the soil away from a root. full definition is a root tip enclosed by a fungus that trades soil water and nutrients for the plant's sugars. When one fungal individual, a genetDefinition: genet population genetics of clonal organisms One genetic individual of a fungus, recognised by its microsatellite profile, which may spread through the soil and colonise many root tips. Excludes a species, and a single fungal thread or fruiting body. full definition, colonises the roots of several trees, the trees are linked through it. Beiler and colleagues mapped such links for Rhizopogon genets on interior Douglas-fir in one 30 by 30 m plot [1]. They reported that tree size went with connectivity and called the network scale-free. A second study [2] mapped six smaller plots on dry and moist sites and released the data. It reported a steeper rise of tree links with diameter on dry sites and argued that the networks would withstand random losses but not the loss of large trees or fungal genets. These maps fed the popular "wood wide web" with large hub trees at its centre.
Karst, Jones and Hoeksema [4] reviewed the field evidence and judged that the claims that such networks are widespread, and that transfer through them helps seedlings, are not supported well enough in the field. They found no peer-reviewed field evidence that mature trees preferentially send resources or signals to their offspring. They also found that papers with positive results were cited more than those without.
Hub structure in a network has a standard test. A degree-preserving shuffleDefinition: degree-preserving shuffle network ecology A control that rewires the links of a network at random while every tree keeps its number of genets and every genet its number of trees, drawn here by the curveball algorithm 1,000 times per plot. Excludes a shuffle that also changes how many links each node has. full definition rewires the links at random while every node keeps its number of links. Structure that survives the shuffle comes from the pattern of who links to whom; structure that the shuffle reproduces comes from the link counts alone. The curveball algorithm of Strona and colleagues [5] draws such shuffles uniformly and fast. A search we ran on 9 November 2026 found no reanalysis of the Beiler 2015 data against degree-preserving shuffles with a sampling-effort control. That is what the search returned; it is not proof that none exists.
The second study uses the long-term log decay experiment at the HJ Andrews Experimental Forest in Oregon. Harmon [6] laid out 530 logs of four conifer species at six old-growth sites in 1985 for a study planned to last 200 years. A Pacific Northwest Research Station summary found by our search gives a whole-log half-time of about 15 years for Pacific silver fir and 100 years for western redcedar. We asked whether that order holds for heartwood and sapwood separately, and whether decay can be forecast for logs not yet sampled.
The third study asks whether the USDA Forest Inventory and Analysis records can say which trees wind damages. It was written as a forecast test on held-out plots, with three predictions drawn from common forestry expectations: bigger trees, more slender trees and trees in recently cut stands should carry more wind damage.
Preregistration and design
All three studies were written as one preregistrationDefinition: preregistration research method (metascience) A dated written plan for a study, fixed and hash-locked before any result is seen: the question, the data, the statistic, the controls, the forecasts and the kill conditions. Excludes a plan revised after looking at the outcome, and a protocol written only for the record after the run. full definition on 29 October 2026, before any confirmatory analysis. Its hash was recorded at once. The file discloses what had been seen: per-plot counts of samples, genets and trees in the network data; sample counts by species and time in the log data; and counts of wind-damaged trees by year and state in the inventory. No relation between any outcome and any predictor had been computed.
One addendum, on slendernessDefinition: slenderness forestry and tree biomechanics Tree height divided by stem diameter at breast height, both in the same units. Excludes the height-to-diameter ratio measured at the base of the stem. full definition and the buckling limit, was appended while the wind script was running and before any of its scores, coefficients or rates had been printed. The old hash was kept and a new one recorded. Both hashes are in the reproduction section.
Each test has a forecast with a numeric pass rule. The network forecasts were that the degree tails would not support a power lawDefinition: power law (scale-free) network science A degree distribution whose tail falls as a fixed power of the degree, so that a few nodes have very many links. A network with such a tail is called scale-free. Excludes skewed distributions with an exponential tail, which also have a few well linked nodes. full definition, that tree diameter would correlate with genets per tree, that sampling effort would correlate with genets per tree at rho above 0.5, and that hub concentration and nestedness would sit inside the shuffled range in at least 4 of 6 plots. Two forecasts pointed the other way: that modularity would exceed the shuffles in at least 4 of 6 plots, and that moist plots would be more connected than dry plots. The decay and wind forecasts are listed with their methods in Section Methods. Forecasts of log density at years 40 and 50 were written to a separate file and hash-locked before the results were written, so they can be scored when those logs are sampled.
Data and provenance
Fungal network
Beiler, Simard and Durall [2] typed 758 tuberculate mycorrhizas from six 10 by 10 m plots of interior Douglas-fir in British Columbia: plots 1 to 3 on dry (xeric) sites and 4 to 6 on moist (mesic) sites. Each root tip was assigned by microsatellites to one genet of Rhizopogon vesiculosus or R. vinicolor and one Douglas-fir genotype. Tree diameter at breast height and age come from a second deposit of tree data for the same plots; 26 of its 35 trees match a tree in the network data. Both deposits are on Dryad under CC0 [3].
Log decay
The log data are the HJ Andrews TD014 long-term log decay experiment [7], principal investigator Mark E. Harmon, under CC BY 4.0. The licence asks for this credit line: Data were provided by the HJ Andrews Experimental Forest research program, funded by the National Science Foundation's Long-Term Ecological Research Program (DEB 1440409), US Forest Service Pacific Northwest Research Station, and Oregon State University.
The four species are Pacific silver fir, Douglas-fir, western redcedar and western hemlock, about 50 cm in diameter, laid on six old-growth sites in 1985. At each sampling a different set of logs is cut. The quantity used is apparent density of heartwood, sapwood, inner bark and outer bark. The local copy of the metadata file was damaged and did not decompress, so the codes were read from the Andrews online metadata page. A wildfire in 2023 burned three of the six sites; this comes from news and Andrews sources and was not checked against site records.
Forest inventory
The wind data are the USDA Forest Service Forest Inventory and Analysis DataMart tree, plot and condition tables for Washington and Oregon [8], which are in the public domain. The population is live trees of 5 inches diameter and over on forested conditions, inventory years 2013 to 2024, when the national damage codes are recorded. That gives 488,499 tree records on 16,128 plots. Records are unweighted, so results describe the sampled trees and not population totals.
Methods
The network tests
One bipartite networkDefinition: bipartite network network science A network with two kinds of node, here trees and fungal genets, in which a link joins a tree to a genet found on at least one of its root tips and never joins two nodes of the same kind. Excludes a network of measured flows between trees. full definition was built per plot, with a link where at least one root tip joins a tree and a genet; both Rhizopogon species are combined. In the tree-tree view, two trees are linked when they share at least one genet. A node's degreeDefinition: degree network science The number of links a node has: the genets on one tree, the trees one genet reaches, or, in the tree-tree view, the other trees that share at least one genet with a tree. Excludes the strength or direction of a link. full definition is its number of links.
Degree distributions pooled over plots were fitted by maximum likelihood to a geometric (discrete exponential) form, a discrete power law and a zero-truncated Poisson, and compared by AICDefinition: AIC statistics (model selection) The Akaike information criterion, twice the number of fitted parameters minus twice the log-likelihood. Between two models fitted to the same data the lower value is preferred, and a gap of 2 or more is the usual bar. Excludes a test that one model is true. full definition. A power law counts as supported only if it beats the geometric form by 2 AIC units or more.
Tree size was tested with Spearman rhoDefinition: Spearman rho statistics The correlation between the ranks of two quantities, from -1 to 1, which counts any steadily rising or falling relation and is not pulled by single extreme values. Excludes the slope of a relation, and evidence of cause. full definition between diameter and genets per tree for the 26 matched trees, with a one-sided p value from 10,000 permutations of diameter within plots and a bootstrap intervalDefinition: bootstrap interval statistics An interval made by recomputing a number many times on units drawn with replacement from the data, here trees, logs or inventory plots, and keeping the middle 95 percent of the results. Excludes an interval that also covers doubt about the model's form. full definition over trees. Sampling effort was controlled with the partial Spearman rhoDefinition: partial Spearman rho statistics The Spearman correlation between two quantities after the ranks of a third, here the number of root tips sampled per tree, have been regressed out of both. Excludes a causal effect, and a correction that is known to be the right size. full definition given the number of root tips sampled per tree.
Hub concentrationDefinition: hub concentration network science, our usage The share of all tree-tree links held by the top 10 percent of trees ranked by their number of tree-tree links. Excludes a measure of how much a hub tree passes to others. full definition, nestedness (NODF)Definition: nestedness (NODF) network ecology The degree to which the partners of poorly linked nodes are a subset of the partners of well linked nodes, scored from 0 to 100 by the NODF index (nestedness based on overlap and decreasing fill). Excludes modules, which are groups of nodes linked mostly among themselves. full definition and modularityDefinition: modularity network science Newman's Q: how far links fall inside groups of nodes rather than between groups, beyond what random links with the same degrees would give. Here the best of 20 Louvain runs. Excludes spatial clumping of samples, which can produce modules without any network structure. full definition were each compared with 1,000 curveball shuffles per plot [5], which form the controlDefinition: control statistics and experimental design A version of the data with the structure under test removed (for example shuffled or pooled), scored the same way as the real data, so the real score has something to beat. Excludes a comparison with a different dataset or with a published number. full definition. The null distributionDefinition: null distribution statistics The spread of scores a control gives over many random draws. Its 95th percentile is the bar a real score must clear. Excludes a theoretical distribution assumed rather than drawn from the data. full definition of each measure is the spread over those draws. Each plot is reported as inside or outside the central 95 percent of the draws and as a z score against the nullDefinition: z score against the null statistics The real value minus the mean of the control draws, divided by their standard deviation. Values beyond 2 in size are rare under the control. Excludes a p value, and a measure of effect size in the units of the data. full definition. Dry and moist plots were compared with the exact permutation test over the 20 ways to split six plots into two groups of three.
The decay tests
For each log, tissue and sampling time, relative densityDefinition: relative density wood science and decomposition ecology The apparent density of a log tissue at a sampling time divided by the same log's density of that tissue when the log was laid out in 1985. Excludes mass loss and carbon loss, which also count the volume a log loses as it fragments. full definition is the mean density divided by the same log's density at time zero. Three models were fitted per species and tissue by nonlinear least squares on years 1 to 16. The single exponential is
where is years since 1985 and is the decay rateDefinition: decay rate k decomposition ecology The constant k in the single-exponential model, the fraction of remaining density lost per year. A half-life is the natural log of 2 divided by k. Excludes a rate measured from mass, and the rate in the first years of a lag model. full definition. The lag model holds until a lag and decays after it:
The Weibull model has a scale and a shape :
Held-out logs at years 20 and 30 are different physical logs from the fitted ones, so a score is a forecast for new logs of a species. The carry-forward baselineDefinition: carry-forward baseline forecast verification The forecast that a later sampling will show the same mean relative density as the last sampling used for fitting, here year 16. Excludes a forecast from a fitted decay curve. full definition is the species and tissue mean at year 16. Forecast skillDefinition: forecast skill forecast verification One minus the mean absolute error of a model's forecast divided by the mean absolute error of a baseline on the same held-out logs. 0 means no better than the baseline and 1 means perfect. Excludes a score on the logs used to fit the model. full definition is
where and are the mean absolute errors of the model and of the baseline on the held-out logs. Intervals come from 2,000 bootstrap draws over logs. A second baseline fits one single exponential to all four species pooled.
The decay forecasts were these. P2.1: at year 30, at least one model beats the baseline for heartwood, with the lower end of its skill interval above 0, in at least 3 of 4 species. P2.2: the lag or Weibull model has lower held-out error than the single exponential for heartwood in at least 3 of 4 species. P2.3: species models beat the pooled model for heartwood at year 30. For the cedar test, eq. 1 was fitted per species on all years 1 to 30, and the difference in between each other species and cedar was bootstrapped over logs 2,000 times. P2.4: cedar heartwood has the lowest , with every difference interval excluding 0. P2.5: cedar sapwood is not the slowest. Only after these fits were frozen were our rates compared with the principal investigator's published heartwood rates.
The wind tests
The outcome is wind damage, national damage code 50013 in any of a tree's three damage fields. The features are species (the 15 commonest, the rest pooled), log diameter, slenderness, crown class, plot elevation, latitude and longitude, slope, aspect as sine and cosine of the angle from south-west, stand age, site class, topographic position, state, and a flag for cutting within 10 years. A random 30 percent of plots, 146,893 trees with 158 wind cases, was held out.
The primary model is logistic regressionDefinition: logistic regression statistics A model that gives the log odds of a yes-or-no outcome, here recorded wind damage, as a weighted sum of the features. Here fitted with an L2 penalty on standardised features. Excludes a model of how much damage a tree has. full definition; gradient boosting and a species-only model are secondary. Scores on held-out trees are log loss, the AUCDefinition: AUC statistics (signal detection) The area under the ROC curve: the chance that a randomly chosen damaged tree is ranked above a randomly chosen undamaged one, with 0.5 for guessing. Excludes how close the predicted probabilities are to the observed rates. full definition and the Brier skillDefinition: Brier skill forecast verification (meteorology) One minus the Brier score of a model divided by the Brier score of always forecasting the base rate, where the Brier score is the mean squared gap between a probability and the outcome coded 0 or 1. Excludes a ranking measure such as AUC, which ignores whether the probabilities are right in size. full definition. The Brier skill is
where is the model's Brier score and that of always forecasting the training base rate. Intervals come from 1,000 bootstrap draws over held-out plots. Effects are reported as an odds ratio per SDDefinition: odds ratio per SD statistics The factor by which the odds of the outcome change when a feature rises by one standard deviation and the other features stay fixed. 1 means no change. Excludes a ratio of probabilities, and a causal effect. full definition with intervals from 200 bootstrap refits.
The wind forecasts were these. P3.1: the logistic model beats the base rate, with a Brier skill above 0, a log-loss gain whose interval excludes 0, and an AUC interval above 0.5. P3.2: odds ratios above 1 for log diameter and for slenderness. P3.3: higher odds in stands cut within 10 years. P3.4: higher odds on south-west facing slopes. The addendum added A1.3: slenderness improves held-out log loss beyond species, size and site.
Controls and planted checks
The main control for the network is the degree-preserving shuffle: a plot whose measure sits inside the shuffled range has no hub, nested or modular structure beyond its link counts. The second control is sampling effort, the number of root tips sampled per tree. It was named in the preregistration with its own forecast, so the effort correlation is a tested result and not a later excuse.
For the decay forecasts the controls are the carry-forward baseline and the pooled-species model. For the wind forecasts the control is the base rate on held-out plots, with species alone as a stronger reference.
No planted checkDefinition: planted check research method; called a positive control in experimental science Data built so that the right answer is known, run through the same analysis before the real data, to show that the analysis can see the effect when it is there. Excludes any check made on the real data, which cannot show what the analysis misses. full definition was run in these studies: no data with a known answer were passed through the analysis first. The nearest check is a known answer from outside. The principal investigator's published single-exponential heartwood rates were opened only after our fits were frozen, and they give the same order: silver fir 0.043, hemlock 0.029, Douglas-fir 0.008 and cedar 0.003 per year. The lack of a planted check is stated again in the limitations.
Results
The fungal network
Genets per tree had a mean of 1.88 and a maximum of 6 over 166 trees; trees per genet a mean of 5.6 and a maximum of 23 over 56 genets. A typical tree shared at least one genet with about 18 others. The power law fitted worst of the three forms: for genets per tree its AIC was 473.1 against 433.2 for the geometric form, a gap of 40 units. The degree distributions are skewed, with an exponential-type tail, and "scale-free" is not supported here. Networks of 13 to 41 trees cannot settle that question in either direction.
Diameter correlated with genets per tree at rho 0.45 (95% bootstrap interval 0.06 to 0.75; permutation p 0.0075, one-sided) for the 26 matched trees, whose diameters run from 10.8 to 52.8 cm. Across all 166 trees, root tips sampled per tree correlated with genets per tree at rho 0.87. Once sampling was controlled, the size link fell to a partial rho of 0.20 (p 0.067), and hub concentration and nestedness sat inside 1,000 degree-preserving shuffles in 6 of 6 plots. Age showed no link with genets per tree (rho -0.07). Diameter against the number of trees linked gave rho 0.25 (p 0.20).
share of links held by the top 10% of trees (higher is more concentrated)
- observed hub share
- central 95% of shuffles
- control mean
Data behind chart 1 6 rows
| Plot | Site type | Trees | Genets | Observed share | Shuffle 2.5% | Shuffle mean | Shuffle 97.5% | Inside |
|---|---|---|---|---|---|---|---|---|
| 1 | Dry sites (xeric) | 27 | 6 | 0.138 | 0.133 | 0.137 | 0.139 | yes |
| 2 | Dry sites (xeric) | 13 | 6 | 0.087 | 0.087 | 0.088 | 0.094 | yes |
| 3 | Dry sites (xeric) | 31 | 9 | 0.143 | 0.137 | 0.142 | 0.147 | yes |
| 4 | Moist sites (mesic) | 27 | 7 | 0.157 | 0.149 | 0.154 | 0.159 | yes |
| 5 | Moist sites (mesic) | 27 | 11 | 0.195 | 0.173 | 0.186 | 0.197 | yes |
| 6 | Moist sites (mesic) | 41 | 17 | 0.164 | 0.154 | 0.163 | 0.171 | yes |
Read from study1_results.json (network study). SHA-256 of the run's file 00c954360fb49e648c5002630b6e1ce3e8552d1b8e9344524a6e7a7075791fab, published unchanged.
nestedness, NODF (higher is more nested)
- observed nestedness
- central 95% of shuffles
- control mean
Data behind chart 2 6 rows
| Plot | Site type | Observed NODF | Shuffle 2.5% | Shuffle mean | Shuffle 97.5% | z |
|---|---|---|---|---|---|---|
| 1 | Dry sites (xeric) | 27.1 | 23.1 | 28.9 | 30.8 | −0.87 |
| 2 | Dry sites (xeric) | 66.3 | 62.0 | 65.9 | 67.7 | +0.22 |
| 3 | Dry sites (xeric) | 42.9 | 39.5 | 42.7 | 44.3 | +0.18 |
| 4 | Moist sites (mesic) | 50.0 | 47.2 | 49.5 | 50.8 | +0.52 |
| 5 | Moist sites (mesic) | 35.1 | 32.0 | 34.9 | 36.8 | +0.16 |
| 6 | Moist sites (mesic) | 35.6 | 32.7 | 34.9 | 36.5 | +0.74 |
Read from study1_results.json (network study). SHA-256 of the run's file 00c954360fb49e648c5002630b6e1ce3e8552d1b8e9344524a6e7a7075791fab, published unchanged.
Table 1 gives each plot's measures, and Figure 1 draws hub concentration against its shuffled range. Plot 2's value sits on the lower edge of its range. Modularity exceeded a z of 2 in 1 of 6 plots (plot 2, z 2.27), so the forecast of modules failed. Samples of the same genet lay closer together than samples of different genets in every plot, so the genets are clumped in space, yet the clumping did not produce modules beyond what the degrees set.
The moist plots were not more connected than the dry ones. Mean trees linked per tree gave an exact p of 0.35, and connectance ran the other way (difference -0.046, p 0.80). With three plots per site type, a failed comparison is not evidence of no difference.
Log decay
At year 30, a decay model beat carrying the year-16 value forward for heartwood in 3 of 4 species, with skill 0.53 to 0.93 (Table 2). Cedar heartwood had barely changed, so carrying the last value forward was already almost right and no model beat it with an interval above 0. At year 20, four years past the fit, only Douglas-fir beat the baseline with an interval above 0 (0.56, 0.45 to 0.74). Short horizons favour the naive forecast.
The lag or Weibull model beat the single exponential for heartwood in 2 of 4 species, so P2.2 failed. In cedar both flexible forms overshot badly: their year-30 errors were 0.22 and 0.53 against 0.04 for the single exponential. Curves fitted to 16 years of almost no change extrapolate to a collapse that had not happened by year 30. Species models beat the pooled model for heartwood, with summed year-30 errors of 0.41 against 1.03.
In the 530-log HJ Andrews experiment, cedar heartwood lost density at 0.0026 per year (95% interval 0.0016 to 0.0038), the slowest of four species, while cedar sapwood ranked third of four. Each other species' heartwood rate exceeded cedar's with an interval that excludes 0: Douglas-fir by 0.0041 (0.0025 to 0.0057), hemlock by 0.0175 (0.0142 to 0.0208) and silver fir by 0.0332 (0.0283 to 0.0383). Figure 2 draws the rates.
density loss per year, k (lower is slower decay)
- Western redcedar
- Other species
- 95% bootstrap interval over logs
Data behind chart 3 8 rows
| Tissue | Species | k per year | 95% low | 95% high | Rank, slowest first | Logs |
|---|---|---|---|---|---|---|
| Heartwood (inner wood) | Western redcedar | 0.0026 | 0.0016 | 0.0038 | 1 of 4 | 54 |
| Heartwood (inner wood) | Douglas-fir | 0.0067 | 0.0055 | 0.0079 | 2 of 4 | 67 |
| Heartwood (inner wood) | Western hemlock | 0.0201 | 0.0169 | 0.0233 | 3 of 4 | 66 |
| Heartwood (inner wood) | Pacific silver fir | 0.0358 | 0.0311 | 0.0408 | 4 of 4 | 54 |
| Sapwood (outer wood) | Douglas-fir | 0.0325 | 0.0281 | 0.0364 | 1 of 4 | 67 |
| Sapwood (outer wood) | Western hemlock | 0.0325 | 0.0279 | 0.0368 | 2 of 4 | 66 |
| Sapwood (outer wood) | Western redcedar | 0.0418 | 0.0362 | 0.0476 | 3 of 4 | 54 |
| Sapwood (outer wood) | Pacific silver fir | 0.0567 | 0.0517 | 0.0625 | 4 of 4 | 53 |
Read from cedar.json (log decay study). SHA-256 of the run's file 8395c10ce46030180a70d534c37924486a4c1ce7efd271d2b2081af73328329d, published unchanged.
If the exponential held, these rates would give heartwood density half-lives of about 270 years for cedar, 100 for Douglas-fir, 35 for hemlock and 20 for silver fir. Those are extrapolations far past 30 years of data. Mean heartwood relative density at year 30 was 0.95 for cedar, 0.79 for Douglas-fir, 0.43 for hemlock and 0.28 for silver fir.
Wind damage
Among 488,499 live trees in Washington and Oregon, 506 (0.10 percent) carried recorded wind damage; a model ranked risk with a held-out AUC of 0.77 but gained a Brier skill of only 0.0014 over the base rate. The log-loss gain over the base rate was 0.00053 (0.00028 to 0.00083), so P3.1 passed with a very small absolute gain. The top 10 percent of trees by logistic risk held 34 percent of the held-out wind cases. Gradient boosting ranked a little better and was worse calibrated (Table 3, Figure 3). The model is a screening ranking. Wind damage is so rare that no tree's probability is high.
AUC on held-out trees (higher is better ranking)
- 95% bootstrap interval
- coin flip, 0.5
Data behind chart 4 3 rows
| Model | AUC | 95% low | 95% high | Share of wind cases in the top tenth by risk |
|---|---|---|---|---|
| Logistic regression (the tested model) | 0.77 | 0.73 | 0.82 | 34% |
| Species alone | 0.63 | 0.55 | 0.69 | 35% |
| Gradient boosting | 0.80 | 0.72 | 0.86 | 46% |
Read from wind_results.json (wind study). SHA-256 of the run's file e7622b4c1844402e06a0b1faa61d50b062632f3090ef8acbe50bbdf9ee775abb, published unchanged.
Brier skill over the base rate (higher is better; 1 would be perfect)
- 95% bootstrap interval
- base rate, 0
Data behind chart 5 4 rows
| Model | Brier skill | 95% low | 95% high | Brier score | Log loss |
|---|---|---|---|---|---|
| Base rate | 0 | 0.0010745 | 0.008428 | ||
| Logistic regression (the tested model) | +0.00138 | +0.00006 | +0.00279 | 0.0010730 | 0.007899 |
| Species alone | +0.00022 | +0.00003 | +0.00038 | 0.0010742 | 0.008321 |
| Gradient boosting | −0.00483 | −0.01534 | +0.00198 | 0.0010797 | 0.007798 |
Read from wind_results.json (wind study). SHA-256 of the run's file e7622b4c1844402e06a0b1faa61d50b062632f3090ef8acbe50bbdf9ee775abb, published unchanged.
The three effect forecasts failed. The odds ratio per SD of log diameter was 0.95 (0.78 to 1.07) and per SD of slenderness 0.83 (0.70 to 1.04). Raw rates fall with size, from 0.13 percent at 5 to 10 inches to 0.05 percent at 30 to 40 inches. Recently cut stands had lower odds, 0.57 (0.39 to 0.99), the reverse of the forecast, with 15 wind cases among 31,453 trees. South-west aspect gave 1.09 (0.94 to 1.31). Wind damage fell going inland: the odds ratio per SD of longitude was 0.69 (0.59 to 0.86).
The addendum test also failed. Adding slenderness changed held-out log loss by -0.0000016 (-0.000037 to 0.000036), and the AUC stayed at 0.775. A likely reason was found after the result and was not preregistered: 29 percent of wind-damaged trees have a broken or missing top, against 5 percent of other trees. Wind damage changes the very height used to compute slenderness, so damage recorded at one visit cannot separate "stocky trees break" from "broken trees measure stocky". The addendum also computed each tree's distance to the height at which an idealised stem of its wood would buckle under its own weight: the median ratio over 462,794 trees of 24 species was 2.01, and 0.05 percent of trees fell below 1.
Discussion
The network result is a check of what the Beiler maps can carry. Beiler and colleagues [1] [2] reported that larger trees are better connected. In the 2015 data that link is there, and most of it tracks how many root tips were sampled on each tree. A larger root system may itself be a real size effect, since a bigger tree has more roots to colonise, so the partial correlation may over-correct. The data cannot separate the two. What the shuffles do show is that hub concentration and nestedness need no explanation beyond each tree's and each genet's number of links. A popular account that rests on hubs as a special structure has to show structure beyond the degrees, and in these plots none was found. This agrees with the caution of Karst and colleagues [4] about how far the mapped networks have been read.
A shared genet shows one fungal individual at two root systems at the points sampled in 2006. It does not show that the fungal threads were continuous at one time, and it shows no transfer of carbon, water, nutrients or signals, no direction, no amount and no benefit. Nothing here bears on whether mature trees favour their kin.
The decay result confirms a long-held view with a precise scope. Cedar heartwood resists decay, and its sapwood does not. The order of our four heartwood rates is the principal investigator's order, and the whole-log half-times in the Station summary put cedar slowest as well. What this study adds is the split by tissue with intervals, a scored forecast on held-out logs and frozen forecasts for years 40 and 50.
The wind result separates two uses of a model. A ranking with an AUC of 0.77 can direct inspection: a tenth of the trees held a third of the damage. A probability forecast with a Brier skill of 0.0014 cannot tell anyone that a given tree will break. Size, slenderness and recent cutting all failed in the direction forecast, and these failures are reported as honest nullsDefinition: honest null research method (our usage) A working test that found no effect beyond a stated bound, a forecast that failed, or an error of our own found and fixed, reported with the same weight as a positive result. Excludes a void run, and a result left unpublished because it was negative. full definition, and the likeliest reason, which we infer and did not test, is how the records are made: the inventory records damage on live trees, a tree that falls in a storm often dies and leaves the live-tree record, and the damage itself changes the measured height.
Limitations
- The network sample is small: 26 trees had a measured diameter, in one forest type and one region, sampled once. Plots of 13 to 41 trees cannot establish or exclude a power-law tail.
- Degree-preserving shuffles keep much of the hub share by construction, so they are a strict control for hubs. Controlling for samples may over-correct.
- No planted check with a known answer was run in any of the three studies.
- The cedar rates repeat the principal investigator's order, which was known in outline before the study. Density loss leaves out volume lost to fragmentation, so it understates total decay. Six sites in one forest were sampled, with about 6 to 9 held-out logs per species at each time.
- The 2023 fire burned three of the six log sites, so the frozen forecasts for years 40 and 50 assume conditions that no longer hold at half the sites. The year-40 and year-50 sampling dates are assumed.
- Outer-bark density is likely biased by survivorship, since only bark still attached can be sampled; it was not used for any claim.
- Wind damage is recorded on live trees, 29 percent of damaged trees had a broken or missing top, and the national code mixes several kinds of damage under one cause. Inventory records are unweighted, so rates describe sampled trees.
- The analyses were run by our own code and were not blind.
- For these reasons the finding is published at tierDefinition: tier our publication register How ready a finding is to publish: A candidate, B signal worth expanding (B* strong), C internal, D honest null worth reporting, E not reliable as it stands. Excludes a measure of how large or how true an effect is. full definition B, a signal worth expanding: a second mapped network with a sampling-effort record, and a remeasured-plot wind test, would be the next steps.
Evidence
Held. Real data and a preregistration, but the network sample is small (26 trees with a measured size), the cedar decay rate repeats rates the experiment's own team has published, and the wind part has almost no skill. The network reanalysis is what merits expansion. Shuffles that keep each tree's number of links keep much of the hub share by construction.
Figures
These are the paper's own figures, numbered as in the PDF, and each "Figure" reference in the text points here. The charts on this page redraw the same results from the result files and carry their own numbers.
Tables
| Plot | Trees | Genets | Root tips | Hub share | Shuffled range | NODF z | Modularity z |
|---|---|---|---|---|---|---|---|
| 1, dry | 27 | 6 | 76 | 0.138 | 0.133 to 0.139 | -0.87 | 1.41 |
| 2, dry | 13 | 6 | 68 | 0.087 | 0.087 to 0.094 | 0.22 | 2.27 |
| 3, dry | 31 | 9 | 127 | 0.143 | 0.137 to 0.147 | 0.18 | -0.36 |
| 4, moist | 27 | 7 | 112 | 0.157 | 0.149 to 0.159 | 0.52 | -0.34 |
| 5, moist | 27 | 11 | 124 | 0.195 | 0.173 to 0.197 | 0.16 | 0.35 |
| 6, moist | 41 | 17 | 251 | 0.164 | 0.154 to 0.171 | 0.74 | 1.50 |
| Species | n | Heartwood k per year | Sapwood k per year | Year-30 heartwood skill |
|---|---|---|---|---|
| Western redcedar | 54 | 0.0026 (0.0016 to 0.0038) | 0.042 (0.036 to 0.048) | 0.007 (0.000 to 0.020) |
| Douglas-fir | 67 | 0.0067 (0.0055 to 0.0079) | 0.032 (0.028 to 0.036) | 0.53 (0.44 to 0.66) |
| Western hemlock | 66 | 0.020 (0.017 to 0.023) | 0.033 (0.028 to 0.037) | 0.53 (0.40 to 0.63) |
| Pacific silver fir | 54 | 0.036 (0.031 to 0.041) | 0.057 (0.052 to 0.063) | 0.93 (0.90 to 0.96) |
| Model | Log loss | Brier skill | AUC | Top 10 percent |
|---|---|---|---|---|
| Base rate | 0.008428 | 0 | 0.5 | none |
| Species only | 0.008321 | 0.0002 (0.00003 to 0.0004) | 0.63 (0.55 to 0.69) | 0.35 |
| Logistic regression | 0.007899 | 0.0014 (0.00006 to 0.0028) | 0.77 (0.73 to 0.82) | 0.34 |
| Gradient boosting | 0.007798 | -0.005 (-0.015 to 0.002) | 0.80 (0.72 to 0.86) | 0.46 |
Appendix A. The preregistered verdicts
Each verdictDefinition: verdict research method (our usage) The pass or fail of one preregistered rule set against the run's numbers, read off by code. Excludes an interpretation written after reading the numbers. full definition is the pass or fail of a rule written before the run. Values are read from the study's result files.
| Test | Deciding rule | Value | Holds |
|---|---|---|---|
| S1.1 | power law does not beat the geometric form by 2 AIC units | power law worse by 40 | yes |
| S1.2 | diameter against genets per tree, rho above 0, one-sided p below 0.05 | rho 0.45, p 0.0075 | yes |
| S1.2c | root tips sampled against genets per tree, rho above 0.5 | rho 0.87 | yes |
| S1.3 | hub share inside the shuffled 95 percent in at least 4 of 6 plots | 6 of 6 | yes |
| S1.4 | NODF z between -2 and 2 in at least 4 of 6 plots | 6 of 6 | yes |
| S1.5 | modularity z above 2 in at least 4 of 6 plots | 1 of 6 | no |
| S1.6 | moist above dry for trees linked and connectance, exact p at most 0.05 | p 0.35 and 0.80 | no |
| P2.1 | a model beats carry-forward for heartwood at year 30 in at least 3 of 4 species | 3 of 4 | yes |
| P2.2 | lag or Weibull beats the single exponential in at least 3 of 4 species | 2 of 4 | no |
| P2.3 | species models beat the pooled model for heartwood at year 30 | 0.41 against 1.03 | yes |
| P2.4 | cedar heartwood k lowest, every difference interval above 0 | 3 of 3 | yes |
| P2.5 | cedar sapwood k not the lowest of four | third of four | yes |
| P3.1 | logistic model beats the base rate in Brier skill, log loss and AUC | 0.0014; 0.00053; 0.77 | yes |
| P3.2 | odds ratios above 1 for log diameter and slenderness | 0.95 and 0.83 | no |
| P3.3 | higher odds in stands cut within 10 years | 0.57 | no |
| P3.4 | higher odds on south-west facing slopes | 1.09 (0.94 to 1.31) | no |
| A1.3 | slenderness improves held-out log loss, interval excluding 0 | -0.0000016 | no |
The frozen forecasts of mean heartwood relative density, with 80 percent intervals for a single new log, are these. Year 40: cedar 0.90 (0.83 to 0.97), Douglas-fir 0.77 (0.66 to 0.87), hemlock 0.45 (0.23 to 0.66), silver fir 0.24 (0.19 to 0.29). Year 50: cedar 0.88 (0.79 to 0.97), Douglas-fir 0.72 (0.58 to 0.85), hemlock 0.37 (0.10 to 0.63), silver fir 0.17 (0.11 to 0.23).
Numbers recorded in our publication register
| What | Value |
|---|---|
| Sample | 6 plots, 166 trees, 56 genets; 530 logs; 488,499 FIA trees |
| Main estimate and interval | partial rho 0.20, p 0.067; cedar k 0.0026 (0.0016, 0.0038); Brier skill 0.0014 |
| Forecast against outcome | log-density forecasts are frozen for years 40 and 50; the forecasts that bigger and more slender trees take more wind damage failed |
| Known-answer check | the published order of decay rates |
As recorded in the publication register, the summary row each finding gets; the paper's own numbers above were re-read from the result files.
What lowers it
- blinding Not blind: the analyst saw the data's shape before the lock. from our publication register, on blinding
- failed check Controls: the degree-preserving shuffles and the sampling-effort control worked; the modularity prediction failed. from our publication register, on controls
- depth of reading The cited literature was read at the level of abstracts, publisher pages and search summaries; full texts were not read. from the Verified section
What holds it up
- scoring Scored by code against rules fixed in advance. from our publication register, on who scored it
- preregistration Preregistered and hash-locked before the run (sha256 5f73b365). from the Reproduce section
- open data Public data. from our publication register, on the data licence
Where the claim stands
- lead
- hypothesis
- thesis
- conjecture
- theorem
- law candidate
- killed
A preregistration with pass-or-fail rules is on file, which this rung needs. The next rung needs a named rival reading beaten by a decisive observation, and none is on file. Tier B: Real data and a preregistration, but the network sample is small (26 trees with a measured size), the cedar decay rate repeats rates the experiment's own team has published, and the wind part has almost no skill. The network reanalysis is what merits expansion. Shuffles that keep each tree's number of links keep much of the hub share by construction.
Trail
Versions
- v2 2026-11-09, paper version 1.0, first published PDF sha256 6753ef0471c19baa
- v1 2026-10-29, entered in the findings ledger
Corrections
2026-11-09 number found by the publication pass
Cedar's year-30 heartwood skill is given as 0.007 from the result file, where the results text rounded it to 0.008.
2026-10-29 wording found by the study itself, before publication
The preregistration addendum on slenderness was appended before any wind score was read; the original hash is kept beside the new one.
Each correction is a dated note; the findings ledger is never rewritten, and a note governs where it differs.
Ledger and version dates up to publication are local dates in US Pacific time. Clock times in the text are UTC, seven or eight hours ahead, so a lock or a run stamped just after midnight UTC belongs to the previous local day. Corrections from 14 November 2026 on are dated in UTC.
References
- Beiler, K. J., Durall, D. M., Simard, S. W., Maxwell, S. A. and Kretzer, A. M. (2010). Architecture of the wood-wide web: Rhizopogon spp. genets link multiple Douglas-fir cohorts. New Phytologist 185, 543-553. doi:10.1111/j.1469-8137.2009.03069.x abstract or summary, 2026-11-09: abstracts, publisher pages and search summaries; full text not read used in Introduction, Discussion
- Beiler, K. J., Simard, S. W. and Durall, D. M. (2015). Topology of tree-mycorrhizal fungus interaction networks in xeric and mesic Douglas-fir forests. Journal of Ecology 103, 616-628. doi:10.1111/1365-2745.12387 run here Licence: TD014 CC BY 4.0 with credit line; Beiler Dryad CC0; FIA public domain used in Introduction, Data and provenance, Discussion
- Beiler, K. J., Simard, S. W. and Durall, D. M. Data from: Topology of tree-mycorrhizal fungus interaction networks in xeric and mesic Douglas-fir forests. Dryad, doi:10.5061/dryad.7ts20; tree data doi:10.5061/dryad.dncjsxkx7. CC0. run here Licence: TD014 CC BY 4.0 with credit line; Beiler Dryad CC0; FIA public domain used in Data and provenance
- Karst, J., Jones, M. D. and Hoeksema, J. D. (2023). Positive citation bias and overinterpreted results lead to misinformation on common mycorrhizal networks in forests. Nature Ecology and Evolution 7, 501-511. doi:10.1038/s41559-023-01986-1 abstract or summary, 2026-11-09: abstracts, publisher pages and search summaries; full text not read used in Introduction, Discussion
- Strona, G., Nappo, D., Boccacci, F., Fattorini, S. and San-Miguel-Ayanz, J. (2014). A fast and unbiased procedure to randomize ecological binary matrices with fixed row and column totals. Nature Communications 5, 4114. doi:10.1038/ncomms5114 abstract or summary, 2026-11-09: abstracts, publisher pages and search summaries; full text not read used in Introduction, Methods
- Harmon, M. E. (1992). Long-term experiments on log decomposition at the H.J. Andrews Experimental Forest. General Technical Report PNW-GTR-280. USDA Forest Service, Pacific Northwest Research Station. doi:10.2737/PNW-GTR-280 abstract or summary, 2026-11-09: abstracts, publisher pages and search summaries; full text not read used in Introduction
- Harmon, M. E. Long-term log decay experiments at the Andrews Experimental Forest, 1985 to 2185 (TD014). HJ Andrews Experimental Forest data catalogue. CC BY 4.0. Data were provided by the HJ Andrews Experimental Forest research program, funded by the National Science Foundation's Long-Term Ecological Research Program (DEB 1440409), US Forest Service Pacific Northwest Research Station, and Oregon State University. run here Licence: TD014 CC BY 4.0 with credit line; Beiler Dryad CC0; FIA public domain used in Data and provenance
- USDA Forest Service. Forest Inventory and Analysis DataMart (FIADB), Washington and Oregon tree, plot and condition tables. Public domain. run here Licence: TD014 CC BY 4.0 with credit line; Beiler Dryad CC0; FIA public domain used in Data and provenance
Cited by later findings
- No later record in the findings ledger treats this finding.
Reproduce
Data
- Beiler 2015. Licence: TD014 CC BY 4.0 with credit line; Beiler Dryad CC0; FIA public domain. https://doi.org/10.1111/1365-2745.12387
- Beiler, K. Licence: TD014 CC BY 4.0 with credit line; Beiler Dryad CC0; FIA public domain. https://doi.org/10.5061/dryad.7ts20
- Harmon, M. Licence: TD014 CC BY 4.0 with credit line; Beiler Dryad CC0; FIA public domain.
- USDA Forest Service. Licence: TD014 CC BY 4.0 with credit line; Beiler Dryad CC0; FIA public domain.
Preregistration
sha256 5f73b365e8e533bfdea8b7f08f764055eeb682817dcfd93a0b599b1e086fe228
plan not recorded
Steps
- Network data: download the Beiler, Simard and Durall 2015 network and tree tables from Dryad. Build one tree by genet network per plot, both Rhizopogon species combined.
- Compare the top 10 percent link share, NODF and modularity with 1,000 curveball shuffles per plot; correlate diameter with genets per tree for matched trees, then partial out root tips sampled per tree.
- Log data: download TD014 from the Andrews data catalogue. Express each log's tissue density relative to its time-zero density, fit eqs. 1, 2 and 3 on years 1 to 16, score years 20 and 30 with eq. 4, and fit eq. 1 on all years with 2,000 bootstrap draws over logs. Credit line: Data were provided by the HJ Andrews Experimental Forest research program, funded by the National Science Foundation's Long-Term Ecological Research Program (DEB 1440409), US Forest Service Pacific Northwest Research Station, and Oregon State University.
- Inventory data: from the FIA DataMart, take live trees of 5 inches and over on forested conditions in Washington and Oregon, 2013 to 2024; model damage code 50013 with L2 logistic regression on 70 percent of plots and score the rest with eq. 5.
- Seed 20261029 for every resampling.
- Preregistration SHA-256, original: 5f73b365e8e533bfdea8b7f08f764055eeb682817dcfd93a0b599b1e086fe228. After the addendum: 9de36743b9e16be56d32fa3cb8e9775c2f1fafd5595b4392bbadf4af7dbc4491. Frozen forecasts SHA-256: 799e57f3e23a8b29e7b24dfca1d2c22d27b0b368aaab2ab3f3a3c72ac294301b. The study was run by stand-alone scripts and has no plan hash or run id.
Cost. No energy or time measurement was recorded for this run. The study was not re-run for this paper.
Downloads
- Whitepaper, PDF F23.pdf, 643 KB
- BuildTeX source F23.bld, 49 KB
- Build receipt F23.buildtex.json, 1 KB
- BuildLang doc module doc.bld, 5 KB, imported by the source
The PDF is typeset by BuildTeX from F23.bld, which is written from the same source as this page. The receipt records the source's SHA-256 and the PDF's (6753ef0471c1), so anyone can rebuild it and compare. The copy here has its hidden author field blanked, as the site does for every file it publishes; blank the same field in a rebuild before comparing. The name stays on the first page.
Verified
Verified on 2026-11-09. On 9 November 2026 the plot, tree, genet and root-tip counts, every per-plot hub share, shuffled range and z score, the AIC values, the size and effort correlations with the partial rho and its p value, the dry against moist p values, every decay rate and difference with its interval, the year-20 and year-30 skills, the wind counts, scores, intervals and odds ratios, and the addendum's log-loss difference and buckling ratio were re-read from the study's machine-written result files and its results text. They match the findings ledgerDefinition: findings ledger our records The append-only, dated list of every result we have recorded, numbered F1, F2 and on. Corrections are added as new dated lines and old entries are never rewritten. Excludes a curated list of successes. full definition. One rounding differs: the results text gives cedar's year-30 skill as 0.008 and the result file gives 0.0075, so this paper uses 0.007. The current preregistration file's SHA-256 matches the addendum hash, and the forecast file's SHA-256 matches its recorded hash. The broken-top shares, the per-size wind rates and the half-lives were read from the results text only. The three figures were drawn by a script that reads only the result files. The title and pages of Beiler and colleagues 2010 come from the study's own citation check of 29 October 2026.
Not checked. The study was not re-run for this paper. The literature in the introduction was found by searches run on 9 November 2026 and read at the level of abstracts, publisher pages and search summaries; the full texts were not read.
Terms on this page
Each term is defined where it is first used on this page. Each name below opens its entry in the findings glossary, which lists every page that uses it.
- mycorrhiza mycology and plant ecology first use
- genet population genetics of clonal organisms first use
- degree-preserving shuffle network ecology first use
- preregistration research method (metascience) first use
- slenderness forestry and tree biomechanics first use
- power law (scale-free) network science first use
- bipartite network network science first use
- degree network science first use
- AIC statistics (model selection) first use
- Spearman rho statistics first use
- bootstrap interval statistics first use
- partial Spearman rho statistics first use
- hub concentration network science, our usage first use
- nestedness (NODF) network ecology first use
- modularity network science first use
- control statistics and experimental design first use
- null distribution statistics first use
- z score against the null statistics first use
- relative density wood science and decomposition ecology first use
- decay rate k decomposition ecology first use
- carry-forward baseline forecast verification first use
- forecast skill forecast verification first use
- logistic regression statistics first use
- AUC statistics (signal detection) first use
- Brier skill forecast verification (meteorology) first use
- odds ratio per SD statistics first use
- planted check research method; called a positive control in experimental science first use
- honest null research method (our usage) first use
- tier our publication register first use
- verdict research method (our usage) first use
- findings ledger our records first use
To report an error, name the finding, the claim number and the source on the Work page, which gives the address. Accepted corrections join the Trail with their date.