
Findings F209 Instruments and control, Plants, trees and earth, Biology and medicine, Method and statistics found 2026-10-31
A simulated dead shoot reads as growing on a lever, and growth-stop detectors fail under misfit
In a simulation with assumed room drift, a lever on a dead shoot reads 5.2 micrometres an hour against a true growth of 2.0 on the live one, and a paired dead shoot recovers the mean but not single readings. Two detectors of the day a tree stem stops growing raise no false alarms on data made by their own model and alarm on 46 to 62 percent of still-growing stems once the model misfits. No plant was measured.
- Tier
- B, signal
- Outcome
- mixed
- Rung
- lead
- Corrections
- 3, latest 2026-11-14
- Version
- v2, 2026-11-14
- Redo it
- Reproduce
Download PDF 504 KB BuildTeX source F209.bld
What this means for a reader
A sensitive growth recorder also records the room. In this simulation a dead shoot on a lever shows more apparent growth than the live shoot has, purely from the warming and dampening we assumed, and a dead partner shoot fixes the average while leaving single readings loose. The second half carries the wider warning: a method for spotting the day a tree stops growing looked perfect until the simulated tree stopped obeying the method's own equations, and then it raised an alarm on about half of the trees that were still growing. Real stem records with independently dated growth stops are what would settle how these detectors behave.
Objection
Nothing was measured. Every parameter is assumed from memory, including the growth rates, the swing, the drift ranges and the rain store.
What would change the call. Real stem records with independently dated growth stops.
From the paper's first stated limitation; our register records no separate objection.
Abstract
In 1920 A. D. Waller told the Royal Society that the plant movement shown on J. C. Bose's crescograph could come from heat, moisture and handling. We simulated that objection, and then the modern form of the same problem: telling growth from swelling in the stem of a tree. Everything here is a simulation with assumed parameters, and no plant was measured. With the assumed room drift, a lever on a dead shoot reads a mean of 5.2 micrometres an hour over 300 simulated runs, against a true growth of 2.0 on the live shoot, and 94 percent of dead runs read above 1. Subtracting a paired dead shoot recovers the mean, 2.04 micrometres an hour, with a spread of 1.03, so 67 percent of single runs land within 1 of the truth. When the simulated stem follows the detector's own model, neither growth-stop detector raises a false alarm in 200 runs, and the stop is flagged after a median of 1 day by a regression detector and 2 days by a daily-maximum detector. Under misfit at 5 micrometres a day, the daily-maximum detector raises a false alarm on 62 percent of stems that never stop and the regression detector on 46 percent; at 1 micrometre a day both alarm on every stem. The clean result came from testing a detector on data made by its own model.
c1 observed, evidence for claim 1
- The numbers in claim 1
- 5.2; 300; 2.0; 94; 1 matches the result file, 2026-11-14
- Chart 1
- The dead-shoot objection as a simulation.
- Basis
- observed: measured in this study, with a result file
c2 observed, evidence for claim 2
- The numbers in claim 2
- 2.04; 1.03; 67; 1 matches the result file, 2026-11-14
- Chart 1
- The dead-shoot objection as a simulation.
- Basis
- observed: measured in this study, with a result file
c3 observed, evidence for claim 3
- The numbers in claim 3
- 200; 1; 2 matches the result file, 2026-11-14
- Chart 2
- False alarms on stems that never stop growing, by scenario and detector.
- Basis
- observed: measured in this study, with a result file
c4 observed, evidence for claim 4
- The numbers in claim 4
- 5; 62; 46; 1 matches the result file, 2026-11-14
- Chart 2
- False alarms on stems that never stop growing, by scenario and detector.
- Basis
- observed: measured in this study, with a result file
Introduction
Jagadis Chandra Bose built the crescographDefinition: crescograph plant physiology (history of instruments) An instrument built by J. C. Bose from about 1917 that magnifies the lengthening of a plant shoot with compound levers, or in a later version a magnetic needle and a light beam, and records it as a trace. Excludes modern optical or electronic growth sensors, which touch the plant far less. full definition to make plant growth visible in seconds. The instrument, from plant physiology, magnifies the lengthening of a shoot with compound levers and writes it as a trace. Bose's 1927 account gives a magnification of 10,000 times by two levers for the high magnification version and far more for a later magnetic version [2]. A report in Nature of the Royal Society meeting of 13 May 1920 records Waller's objection after a demonstration at a claimed ten-million-fold magnification: he judged the demonstration illusory, and held that effects with no physiological cause, visible at a thousand-fold, could hide or imitate the physiological ones [1]. The title of his paper extended apparent growth to inanimate materials.
The objection is a statement about a control. A recorder that cannot tell growth from thermal expansion or moisture swelling needs a specimen that does everything a living shoot does except grow. A dead shoot is the plain candidate. We wanted to size the problem: how large the drift is against the growth under stated assumptions, and how well a dead partner removes it when the partner is not an exact twin.
The modern form of the question is asked of trees. A dendrometerDefinition: dendrometer forest science A gauge that records the size of a tree stem, here an electronic sensor reading the stem radius many times a day. Excludes any direct count of new wood cells; the gauge records size, which also changes with the water held in the stem. full definition records the radius of a stem through the day. In forest science the term covers any gauge of stem size, from a band read by eye to an electronic point sensor; it records size and cannot by itself say which part of a change is new wood. Stems shrink by day as water is drawn out and swell at night, and this swing can be many times the daily growth. The zero-growth conceptDefinition: zero-growth concept tree physiology The rule, due to Zweifel and colleagues, that a stem is counted as growing only while it exceeds its own previous maximum radius, with every reading below that maximum treated as water deficit. Excludes the linear-growth alternative, in which growth is assumed to continue through periods of shrinkage. full definition of Zweifel and colleagues counts growth only when the stem passes its previous maximum and treats everything below that maximum as water deficit [3]. A practical question follows: how soon after growth stops for the season can a record show it. The decision this study informed was whether to spend effort on a detector that models the daily swing, or to stay with the running maximum.
Our searches found the historical report and the zero-growth literature. They did not look for published tests of cessation detectors on simulated stems, so we make no claim that this comparison is new.
Preregistration and design
There was no preregistrationDefinition: preregistration research method (metascience) A dated written plan for a study, fixed and hash-locked before any result is seen: the question, the data, the statistic, the controls, the forecasts and the kill conditions. Excludes a plan revised after looking at the outcome, and a protocol written only for the record after the run. full definition, meaning no dated plan locked by a hash before the run. Forecasts were written to a file on 31 October 2026 before any simulation ran, and the file says so in its own first line. It holds four forecasts for this study: that a dead shoot on a lever would read as growing (probability 0.9), that the daily-maximum detector would flag a stop after 5 days, that the regression detector would flag it after 3, and that the regression detector would beat the daily maximum (probability 0.5).
No kill conditionDefinition: kill condition research method (our usage, after Popper's falsification) A rule written in the preregistration that, when met, decides against the claim with no room for judgement after the run. Excludes reasons found after the run for setting a result aside. full definition, an outcome fixed in advance that would end the claim, was set, and no pass or fail rules. Our register records that the first version of the stem test had only the matched case, in which the detector's model is the generator's model, and that the misfit scenarios were added after that result was seen. The misfit scenarios are therefore a correction made after a first look, and are reported as that.
Data and provenance
There is no external dataset. Every input is an assumed parameter, chosen from memory and not checked against a measurement: shoot elongation of 2 micrometres an hour, a daily stem swing of 100 micrometres, radial growth of 5 micrometres a day, and the drift ranges given below. The simulation is a short Python program with NumPy, run once with a fixed seed. The historical facts come from the two sources cited in the introduction.
Methods
The lever and the dead shoot
Each of 300 runs is a 10-minute record sampled every 5 seconds, in micrometres of displacement at the specimen. The lever's magnification does not enter; the lever is represented by its dead bandDefinition: dead band mechanical engineering and instrumentation The range of input movement to which a mechanism gives no output, from slack or friction in its joints. Here 0.05 micrometres at the specimen. Excludes random noise, which moves the output both ways. full definition, a mechanical slack of 0.05 micrometres below which the pointer does not follow the specimen.
A live shoot's displacement is the sum of four parts: growth at 2.0 micrometres an hour; thermal expansion of a 10 cm frame and tissue with a coefficient of 1.2e-5 per kelvin, for a room warming by 0.02 to 0.2 K over the record; hygroscopic swellingDefinition: hygroscopic swelling materials science and plant anatomy The change in size of a material as it takes up water vapour from the air. Plant tissue, wood and gut strings all lengthen or swell this way with no living process involved. Excludes growth, which adds new cells or enlarges living ones, and thermal expansion. full definition of 0 to 1.5 micrometres over the record, which is the lengthening of tissue as it takes up moisture from the air; and a small random walk for handling. Warming and swelling are drawn uniformly from those ranges for each run and rise linearly in time. A dead shoot has no growth, its own handling noise, and the same warming and swelling scaled by a factor drawn between 0.7 and 1.3, because a dead shoot is not a twin of the live one.
The reading is the least-squares slope of the pointer trace over the record. The paired estimate of growth is
The mean drift the assumptions imply can be written down without a simulation. With a mean warming of 0.11 K and a mean swelling of 0.75 micrometres, the common displacement over the record is
micrometres, where 1.2 micrometres per kelvin is the coefficient times the 10 cm length. Over a record of 595 seconds that is about 5.3 micrometres an hour. The swelling term supplies most of it.
The stem
A stem is simulated hourly for 60 days. Its radius is
Here is growth, rising at a fixed rate per day until the stop and flat after it. is the swing, 100 micrometres. is the water tension: a daytime half-sine of vapour pressure deficitDefinition: vapour pressure deficit meteorology and plant physiology The difference between the water vapour pressure of saturated air at the current temperature and the vapour pressure the air has. A measure of how strongly the air draws water from a plant. Excludes relative humidity, which is a ratio and does not scale with drying demand across temperatures. full definition, scaled by a weather factor that changes from day to day, and smoothed by an exponential memory with time constant . Vapour pressure deficit, from meteorology, is the gap between the water vapour the air holds and what it could hold, and here it stands for the drying demand on the tree. is a drying term that grows after the stop in the scenarios that include it. is rain: a store that refills on random days and drains over about three days. is sensor noise of 1 micrometre.
Each scenario simulates 200 stems that stop growing on day 40 and 200 that never stop.
Two detectors
The daily-maximum detector takes each day's largest radius, keeps the running maximum, and flags a stop when the running maximum has gained no more than 0.5 micrometres for 4 days in a row. It is a simplified reading of the zero-growth concept written for this study, and is not the published method or its software.
The regression detector fits each 8-day window with the vapour pressure deficit smoothed at a 4-hour time constant, a straight-line trend, and a daily sine and cosine, and flags a stop when the fitted trend falls below 0.3 of the growth rate. It is told the true growth rate, which favours it. Both detectors start after a 15-day baseline.
A false alarmDefinition: false alarm signal detection A detection reported when the event did not happen. Here a growth stop flagged on a simulated stem that never stops growing. Excludes an early flag on a stem that does stop later, which is counted apart. full definition is a flag on a stem that never stops. An early flag is a flag before day 40 on a stem that does stop. The lag is the flag day minus 40, and its median is taken over flags that are not early.
Matched and misfit scenarios
In the matched scenarios the generator uses the same 4-hour time constant as the regression detector, no rain, and a vapour pressure deficit measured with noise of 0.05. Testing an inverse method on data made by its own forward model is known in the inverse-problems literature as an inverse crimeDefinition: inverse crime inverse problems (applied mathematics) Testing a reconstruction or detection method on synthetic data produced by the same model the method assumes, which makes the method look better than it is on real data. Excludes tests on data from a different or richer model, and tests on measurements. full definition, because it hides every error of the model. The misfitDefinition: misfit statistics and modelling A difference between the process that made the data and the model the analysis assumes. Here a slower water memory, an unmodelled rain store and a noisier humidity record. Excludes measurement noise alone, which the matched scenarios also contain. full definition scenarios break the match in three ways at once: the generator's time constant is 7 hours, rain is on, and the vapour pressure deficit is measured with noise of 0.2. They were run at growth rates of 5 and 1 micrometres a day.
Controls and planted checks
The stems that never stop are the controlDefinition: control statistics and experimental design A version of the data with the structure under test removed (for example shuffled or pooled), scored the same way as the real data, so the real score has something to beat. Excludes a comparison with a different dataset or with a published number. full definition for every detector: any flag on them is false. The matched scenarios serve as the known-answer case, since there the regression detector's model is exactly right and the stop day is known.
- planted checkPlanted: growth of 2.0 micrometres an hourA live shoot that grows at a known rate and a dead shoot that does not grow, on the same lever, in a room that warms and dampens by amounts we assumed.
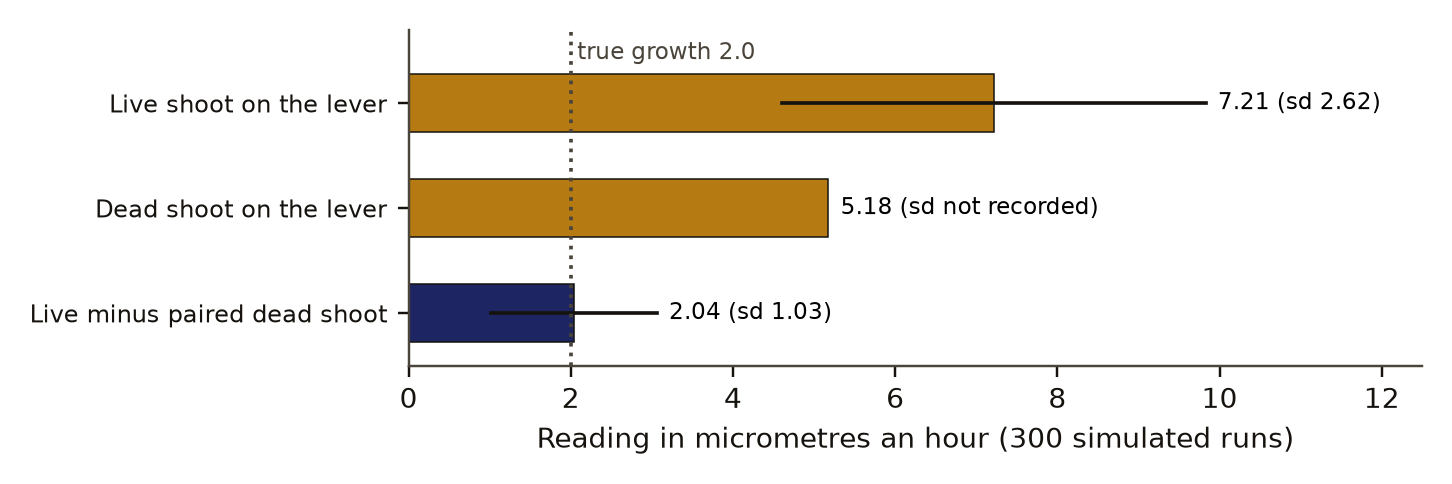
- measurementWhat the lever readsThe live shoot reads a mean of 7.2; the dead shoot reads 5.2, and 94 percent of dead runs read above 1.
- controlControl: a paired dead shootSubtracting the dead shoot's reading gives a mean of 2.04 with a spread of 1.03; 67 percent of single runs land within 1 of the truth.
- an illustrationThe reading restates the assumed driftThe dead-shoot number follows from the drift ranges by arithmetic. It shows the size of drift that would bury the growth and is no evidence about the historical instrument.
Read from results.json (the simulation's result file; the crescograph block). SHA-256 of the run's file f9f6d525caa8adde2ba1bb167c1a6ac01750a46cdcadcb080d02ea342e389b37 and of the published copy 37f7673ca70da615a11f44ec724875c6726a483e87fbea68235ac0069b361e83. In the copy, file paths are cut to the file name and the layout (indentation, line endings) may differ; every value is the same.
There is no control for the lever simulation beyond the arithmetic of eq. 2, which the simulated dead reading should and does come close to. No noise-only or shuffled version of the stem series was run.
Results
The lever
With the assumed room drift, a lever on a dead shoot reads a mean of 5.2 micrometres an hour over 300 simulated runs, against a true growth of 2.0 on the live shoot, and 94 percent of dead runs read above 1. The live shoot on the same lever reads a mean of 7.2 with a standard deviation of 2.6, more than three times its true growth. The dead reading of 5.2 sits close to the 5.3 that eq. 2 gives, so this number restates the assumed drift ranges and could not have come out far from them. What it shows is the size of drift that would bury the growth: under 1 micrometre of swelling and a tenth of a kelvin in ten minutes.
Subtracting a paired dead shoot recovers the mean, 2.04 micrometres an hour, with a spread of 1.03, so 67 percent of single runs land within 1 of the truth. The spread is half the growth rate. It follows from the assumed mismatch of up to 30 percent between the two shoots. Figure 1 shows the three readings.
The stem
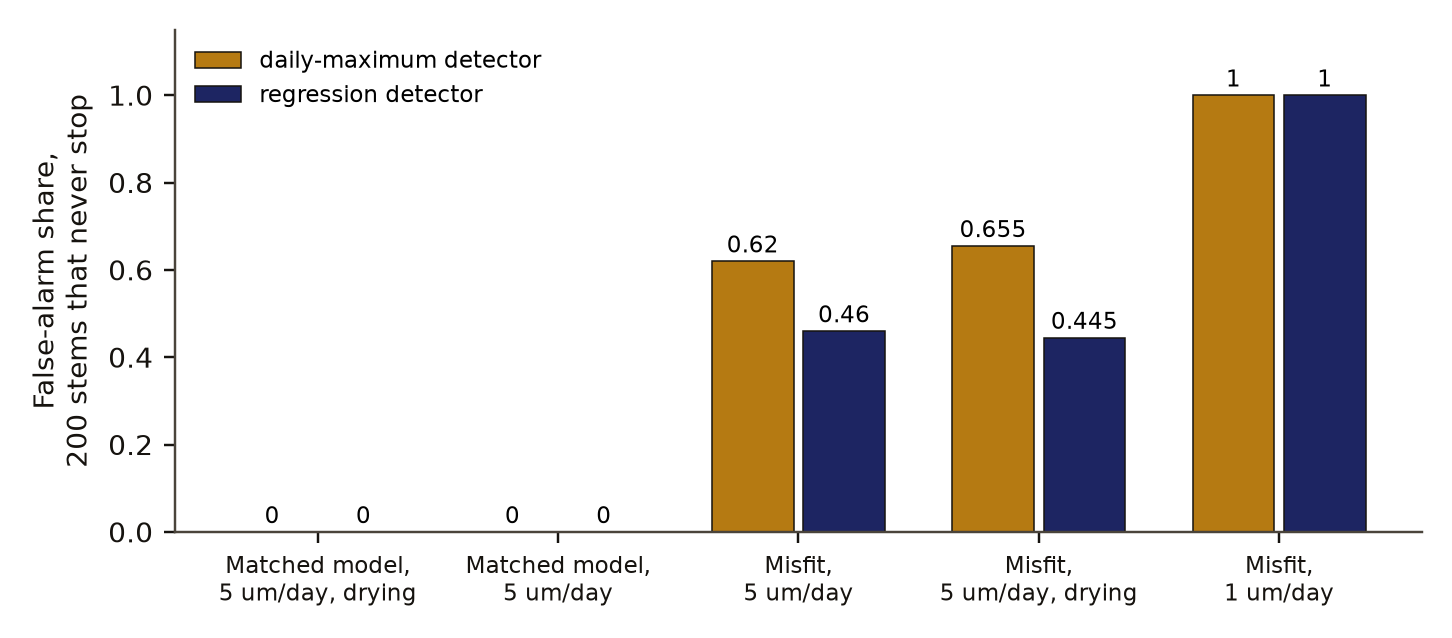
When the simulated stem follows the detector's own model, neither growth-stop detector raises a false alarm in 200 runs, and the stop is flagged after a median of 1 day by a regression detector and 2 days by a daily-maximum detector. That is the scenario with drying after the stop. Without drying both detectors take a median of 2 days.
Under misfit at 5 micrometres a day, the daily-maximum detector raises a false alarm on 62 percent of stems that never stop and the regression detector on 46 percent; at 1 micrometre a day both alarm on every stem. Those shares are 124 and 92 of 200 stems. The regression detector's count is lower by 32 stems, and it is still wrong on nearly half the stems that never stop. On stems that do stop, the detectors flag before the stop in 49 and 35.5 percent of runs. Table 1 gives all five scenarios and Figure 2 the false alarms.
Neither detector missed a stop in any scenario; every stopping stem was flagged, early or late.
Table 2 sets the forecasts against the outcomes. The first forecast was a probability and the outcome beside it is a share of runs, so the two are of different kinds.
Discussion
The lever result is a sizing exercise. If a cut shoot in a lecture room swells by a micrometre in ten minutes, a lever reads several times the growth, and it does so on dead tissue. Whether real shoots swell that much is a question for a measurement, and our ranges are guesses. The pairing result has a practical edge: a dead partner removes the average drift, and the single-run error is set by how alike the two specimens are. An experimenter would need many pairs, or a better twin, before trusting one trace.
The stem result is the one we would act on. With the generator matched to the detector, the regression detector looked a day faster with no false alarms. That was the inverse crime at work. Once the stem had a slower water memory than the detector assumed, rain the detector had no term for, and a noisier humidity record, both detectors flagged stops that never happened on about half the stems, and at a slow growth rate on all of them. The regression detector's lower false-alarm share under misfit is real in these counts and has no practical use at that level.
Two things follow for our own work. A detector of this kind gets no credit from a matched simulation. The next test has to use recorded stems with a stop date known from another method.
Limitations
- Nothing was measured. Every parameter is assumed from memory, including the growth rates, the swing, the drift ranges and the rain store.
- The dead-shoot reading follows from the assumed drift ranges by arithmetic, so it is an illustration of the objection and no evidence about Bose's instrument or his results.
- The lever is modelled only by a dead band. Friction, creep of the levers and the contact with the plant are left out.
- The simulated instrument is the 10,000 times lever version. Waller's objection, as reported, was to a demonstration at a claimed ten-million-fold magnification.
- The daily-maximum detector is our simplification of the zero-growth concept. Its failure here says nothing about the published method on real data.
- The regression detector is told the true growth rate, and the misfit scenarios change three things at once, so the result does not say which misfit does the damage.
- One seed, one run. The shares rest on 200 or 300 simulated runs, and no interval was computed in the study.
- The misfit scenarios were added after the matched result was seen.
- Scoring was by our own code and was not blind. Nobody outside the project has checked it.
Evidence
Mixed. Under misfit at 5 micrometres a day the daily-maximum detector raised false alarms on 124 of 200 stems that never stop and the regression detector on 92 of 200; at 1 micrometre a day both alarmed on all 200. The forecast that the regression detector beats the daily maximum held only by 1 day in the matched case with drying, and no claim is made under misfit. The paired dead shoot left a spread of 1.03 micrometres an hour on a growth of 2.0.
Figures
These are the paper's own figures, numbered as in the PDF, and each "Figure" reference in the text points here. The charts on this page redraw the same results from the result files and carry their own numbers.
Tables
| Scenario | Detector | False alarms | Early flags | Median lag, days |
|---|---|---|---|---|
| Matched, drying, 5 a day | Daily maximum | 0 | 0 | 2 |
| Matched, drying, 5 a day | Regression | 0 | 0 | 1 |
| Matched, 5 a day | Daily maximum | 0 | 0 | 2 |
| Matched, 5 a day | Regression | 0 | 0 | 2 |
| Misfit, 5 a day | Daily maximum | 0.62 | 0.49 | 3 |
| Misfit, 5 a day | Regression | 0.46 | 0.355 | 2 |
| Misfit, drying, 5 a day | Daily maximum | 0.655 | 0.505 | 2 |
| Misfit, drying, 5 a day | Regression | 0.445 | 0.40 | 1 |
| Misfit, 1 a day | Daily maximum | 1.0 | 1.0 | none on time |
| Misfit, 1 a day | Regression | 1.0 | 0.995 | 5, from one run |
| Quantity | Forecast | Outcome |
|---|---|---|
| A dead shoot reads as growing | probability 0.9 | 94 percent of dead runs read above 1 micrometre an hour |
| Daily-maximum detector, days to flag | 5 | 2 when matched |
| Regression detector, days to flag | 3 | 1 when matched with drying, 2 without |
| Regression beats daily maximum | probability 0.5 | by 1 day when matched with drying; no claim under misfit |
Appendix A. Assumed parameters
Every value below was chosen by us and none was fitted to data.
| Parameter | Matched | Misfit |
|---|---|---|
| Shoot growth, micrometres an hour | 2.0 | same |
| Room warming over 10 minutes, K | 0.02 to 0.2 | same |
| Swelling over 10 minutes, micrometres | 0 to 1.5 | same |
| Dead-shoot drift factor | 0.7 to 1.3 | same |
| Lever dead band, micrometres | 0.05 | same |
| Stem swing, micrometres | 100 | 100 |
| Stem growth, micrometres a day | 5 | 5 or 1 |
| Sensor noise, micrometres | 1 | 1 |
| Water memory of the stem, hours | 4 | 7 |
| Water memory assumed by the detector, hours | 4 | 4 |
| Rain store | off | 5 to 30 micrometres, on 8 of 60 days |
| Noise on vapour pressure deficit | 0.05 | 0.2 |
Numbers recorded in our publication register
| What | Value |
|---|---|
| Sample | 300 simulated lever runs; 200 stopping and 200 non-stopping stems per scenario |
| Main estimate and interval | no interval was computed; one seed |
| Forecast against outcome | A dead shoot reads as growing: forecast probability 0.9, and 94 percent of dead runs read above 1 micrometre an hour. Regression beats daily maximum: forecast 0.5; by 1 day when matched with drying, and no claim under misfit |
| Known-answer check | the dead-shoot reading of 5.2 sits beside the 5.3 that the assumed drift gives by arithmetic |
As recorded in the publication register, the summary row each finding gets; the paper's own numbers above were re-read from the result files.
What lowers it
- blinding Not blind. No preregistration; the misfit scenarios were added after the matched result was seen. from our publication register, on blinding
- depth of reading The cited literature was read at the level of abstracts and search snippets; full texts were not read. from the Verified section
What holds it up
- scoring Scored by code against rules fixed in advance. from our publication register, on who scored it
- control Controls: misfit scenarios, added after the matched result was seen. from our publication register, on controls
Where the claim stands
- lead
- hypothesis
- thesis
- conjecture
- theorem
- law candidate
- killed
An observation with a source. No prediction with a kill condition was on file before the run, which the next rung needs. Tier B: A clear next test on real data. The first result, with no false alarms, came from testing a detector on data made by its own model, and was corrected the same day.
Trail
Versions
- v2 2026-11-14, paper version 1.0, first published PDF sha256 85ea0017dcaef567
- v1 2026-10-31, entered in the findings ledger
Corrections
2026-11-14 wording found by the publication pass
The dead-shoot reading is now stated as a consequence of the assumed drift, with the arithmetic beside it.
2026-11-14 number found by the publication pass
The ledger title says the two detectors tie under misfit. now The result file gives 92 against 124 false alarms in 200 stems. This paper states both counts and calls neither detector usable; the word "tie" is dropped.
2026-10-31 retraction found by the study itself, before publication
The first version of the stem test used only a generator matched to the regression detector, and gave no false alarms. now The misfit scenarios were added the same day, and the claim that the regression detector beats the daily maximum was withdrawn for the misfit case.
Each correction is a dated note; the findings ledger is never rewritten, and a note governs where it differs.
Ledger and version dates up to publication are local dates in US Pacific time. Clock times in the text are UTC, seven or eight hours ahead, so a lock or a run stamped just after midnight UTC belongs to the previous local day. Corrections from 14 November 2026 on are dated in UTC.
References
- Societies and Academies (1920). Report of the Royal Society meeting of 13 May 1920, with A. D. Waller's paper on apparent growth of plants and of inanimate materials. Nature 105, 410-411. doi:10.1038/105410a0 abstract or summary, 2026-11-14: abstracts and search snippets; full text not read used in Introduction
- Bose, J. C. (1927). Plant Autographs and Their Revelations. Internet Archive item plantautographst00bose. abstract or summary, 2026-11-14: abstracts and search snippets; full text not read used in Introduction
- Zweifel, R., Haeni, M., Buchmann, N. and Eugster, W. (2016). Are trees able to grow in periods of stem shrinkage? New Phytologist 211(3), 839-849. doi:10.1111/nph.13995 abstract or summary, 2026-11-14: abstracts and search snippets; full text not read used in Introduction
Cited by later findings
- No later record in the findings ledger treats this finding.
Reproduce
Steps
- Data: no external dataset. The inputs are the assumed parameters listed in the Methods section; the simulation code is not yet in a public repository.
- Lever: for each of 300 runs, build a 10-minute trace every 5 seconds from growth, thermal expansion, swelling and a random walk, pass it through a dead band of 0.05 micrometres, and fit a slope. Do the same for a dead shoot with the drift scaled by a factor between 0.7 and 1.3, and apply eq. 1.
- Stem: simulate eq. 3 hourly for 60 days, 200 stems with a stop on day 40 and 200 without, in the five scenarios of Table 1.
- Run both detectors on every stem and count false alarms, early flags and lags.
- Random numbers: NumPy default generator, seed 20261036.
- No preregistration exists, so there is no preregistration hash, plan hash or run id. The forecast file carries a written date and no hash.
Cost. The simulation took about 6 s on one desktop CPU. The simulation was not re-run for this paper.
Downloads
- Whitepaper, PDF F209.pdf, 504 KB
- BuildTeX source F209.bld, 30 KB
- Build receipt F209.buildtex.json, 1 KB
- BuildLang doc module doc.bld, 5 KB, imported by the source
The PDF is typeset by BuildTeX from F209.bld, which is written from the same source as this page. The receipt records the source's SHA-256 and the PDF's (85ea0017dcae), so anyone can rebuild it and compare. The copy here has its hidden author field blanked, as the site does for every file it publishes; blank the same field in a rebuild before comparing. The name stays on the first page.
Verified
Verified on 2026-11-14. On 14 November 2026 the lever means, standard deviations and shares, and every false-alarm share, early share and median lag in the five stem scenarios were re-read from the simulation's result file, and the four forecasts from the forecast file. They match the findings ledgerDefinition: findings ledger our records The append-only, dated list of every result we have recorded, numbered F1, F2 and on. Corrections are added as new dated lines and old entries are never rewritten. Excludes a curated list of successes. full definition except for the word "tie", which is corrected below. The parameter values, run counts, detector rules and the seed were read from the simulation's source code. The drift of 5.3 micrometres an hour is our arithmetic for this paper from the code's parameter ranges. The counts 124 and 92 are the file's shares times 200. Both figures were drawn by a script that reads only the result file. The order in which the matched and misfit scenarios were written rests on our register's note; no file timestamp was used to confirm it.
Not checked. The simulation was not re-run for this paper. The literature was found by two searches on 14 November 2026 and read at the level of abstracts and search snippets; the full texts were not read. The magnification figures attributed to Bose's 1927 book come from our census record of that source, made on 31 October 2026; the book itself was not opened for this paper.
Terms on this page
Each term is defined where it is first used on this page. Each name below opens its entry in the findings glossary, which lists every page that uses it.
- crescograph plant physiology (history of instruments) first use
- dendrometer forest science first use
- zero-growth concept tree physiology first use
- preregistration research method (metascience) first use
- kill condition research method (our usage, after Popper's falsification) first use
- dead band mechanical engineering and instrumentation first use
- hygroscopic swelling materials science and plant anatomy first use
- vapour pressure deficit meteorology and plant physiology first use
- false alarm signal detection first use
- inverse crime inverse problems (applied mathematics) first use
- misfit statistics and modelling first use
- control statistics and experimental design first use
- findings ledger our records first use
To report an error, name the finding, the claim number and the source on the Work page, which gives the address. Accepted corrections join the Trail with their date.