
Findings F190 Biology and medicine, Society and economics found 2026-10-31
Our model of cooperation on a grid had been rewarding selfishness
We set out to reproduce a textbook result, that living near relatives lets costly cooperation survive cheaters, and our model appeared to succeed. It had a flaw: cooperators were paid back by their own contribution. With that removed, cooperation collapsed at every benefit-to-cost ratio up to 50 under our update rule, and reached a share of only 0.48 at a ratio of 400.
- Tier
- D, honest null
- Outcome
- prediction failed
- Rung
- killed
- Verdicts
- 7 passed, 2 failed, 1 untestable
- Corrections
- 4, latest 2026-11-14
- Version
- v3, 2026-11-14
- Redo it
- Reproduce
Download PDF 477 KB BuildTeX source F190.bld
What this means for a reader
A simulation can match a known answer for the wrong reason. Ours produced a clean threshold for when cooperation survives, close to a number from the theory literature, and we credited the theory. The match came from a coding choice that let each cooperator keep part of its own contribution, which turns cooperation into private investment. If you build or read individual-based models of microbes, markets or teams, check whether the "cooperators" are paid by their own act.
Objection
One update rule, fitness-proportional and synchronous, with invented numbers. Other update rules, asynchronous timing, other neighbourhood sizes or a parent window separate from the goods box could let producers persist.
What would change the call. Our publication register records no condition that would raise or overturn this call.
From the paper's first stated limitation; our register records no separate objection.
Abstract
Microbes that release costly products into their surroundings are exposed to cheaters that take the benefit and skip the cost. A standard result in social evolution says that when relatives stay near each other, producers can persist anyway. We tried to reproduce that on a simple grid model before using the idea in our own writing, and in the second of three preregistered rounds the model seemed to succeed, with a threshold that matched a rule from the theory literature. It had a flaw: each producer received a share of its own goods. The shuffled control, which should have collapsed, kept producers at a mean share of 0.37 (95th percentile 0.52), and with a 3 by 3 goods box a producer recovers a ninth of its own output, so producing paid for itself whenever the benefit-to-cost ratio passed 9. The third round paid goods to others only. With goods paid to others only, local producers ended at a share of 0.03 at a benefit-to-cost ratio of 100, 0.19 at 200 and 0.48 at 400, and never reached the preregistered bar of 0.5. Under this update rule, space alone gave producers no foothold at any benefit-to-cost ratio up to 50, where their share was 0.00.
c1 observed, evidence for claim 1
- The numbers in claim 1
- 0.37; 95; 0.52; 3; 9 matches the result file, 2026-11-09
- Chart 1
- How the flaw was found: a control that should have collapsed did not.
- Chart 2
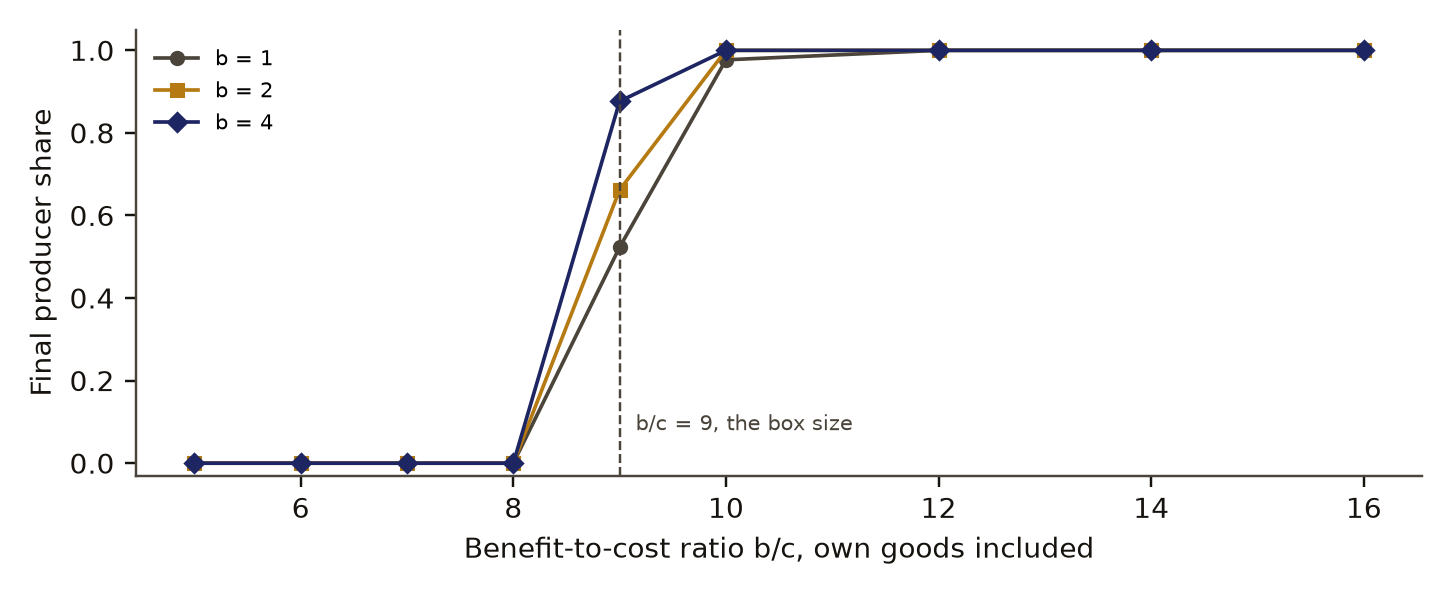
- Round two, own goods included: producer share against the benefit-to-cost ratio.
- Chart 3
- Round two at a ratio of 20: local producers against the shuffled control.
- Basis
- observed: measured in this study, with a result file
c2 observed, evidence for claim 2
- The numbers in claim 2
- 0.03; 100; 0.19; 200; 0.48; 400; 0.5 matches the result file, 2026-11-09
- Chart 1
- How the flaw was found: a control that should have collapsed did not.
- Chart 4
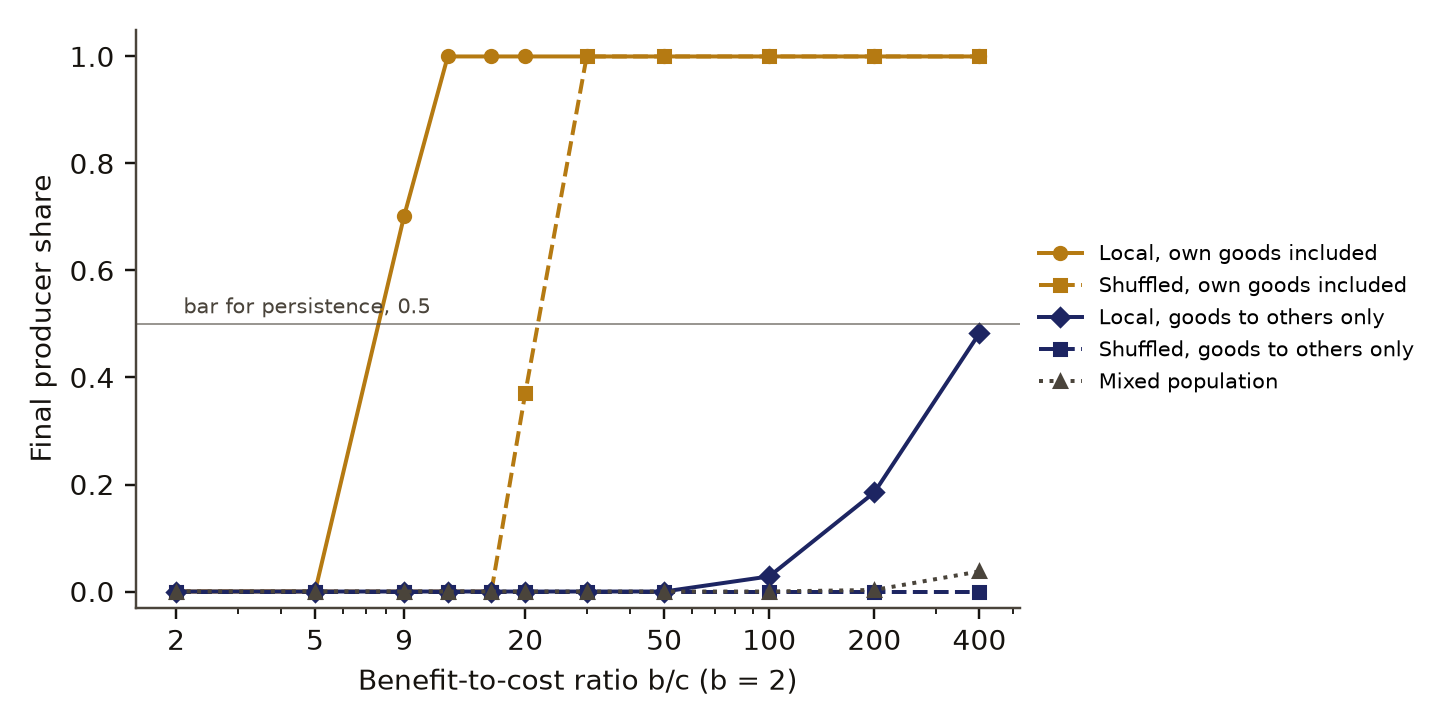
- Round three at b of 2: the same model with and without the producer's own share.
- Chart 5
- Rules fixed in advance for rounds two and three, the value each tested and its bar.
- Basis
- observed: measured in this study, with a result file
Introduction
Many bacteria release a public goodDefinition: public good social evolution and economics A product that costs its maker something and benefits others nearby, such as an enzyme or iron-scavenging molecule a microbe releases into its surroundings. Excludes products the maker keeps for itself. full definition, a product that costs its maker something and helps others nearby. Iron-scavenging siderophores are a studied case. In a population where everyone meets everyone, a cheaterDefinition: producer and cheater social evolution A producer pays a cost to make the public good. A cheater makes none and still gains from the goods of producers near it. Excludes any intention on either side; the words name two fixed strategies. full definition that makes none and takes the benefit should win. Kin selection gives one way out: if producers mostly help relatives, which are also producers, production can spread.
Space is the usual route to relatedness in microbes, because daughter cells stay near their parents. Nadell, Drescher and Foster [1] review how the spatial arrangement of clones and species in biofilms shapes cooperation and competition. Space also has a cost. Taylor [2] showed with an inclusive fitness model that in a patch-structured population the benefit of helping relatives and the cost of local competitionDefinition: local competition social evolution, after Taylor and after Griffin and colleagues Competition for space or resources among neighbours, which, when neighbours are relatives, can cancel the benefit that helping relatives brings. Excludes competition spread over the whole population. full definition among them can cancel exactly, the same result Wilson, Pollock and Dugatkin [3] reached by simulation. Griffin, West and Buckling [4] tested it in the bacterium Pseudomonas aeruginosa by setting relatedness and the scale of competition independently, and found that cooperation rose with relatedness and fell when competition was more local.
On graphs, Ohtsuki, Hauert, Lieberman and Nowak [5] found that selection favours cooperation when the benefit-to-cost ratio exceeds the average number of neighbours. We used that rule in our second round to forecast a threshold, and the forecast came true for a reason the rule had nothing to do with.
Preregistration and design
The study ran in three rounds on 31 October 2026, each under its own preregistrationDefinition: preregistration research method (metascience) A dated written plan for a study, fixed and hash-locked before any result is seen: the question, the data, the statistic, the controls, the forecasts and the kill conditions. Excludes a plan revised after looking at the outcome, and a protocol written only for the record after the run. full definition, hash-locked before that round ran and written after reading the round before. The decision they inform was stated in the third: whether our own writing may say that space protects cooperators on the strength of our own model, or must only cite published work for it.
- Round one asked whether producers persist under local rules at of 2 and of 0.3 and collapse when mixed or shuffled. Its kill conditionsDefinition: kill condition research method (our usage, after Popper's falsification) A rule written in the preregistration that, when met, decides against the claim with no room for judgement after the run. Excludes reasons found after the run for setting a result aside. full definition: if the mixed arm does not collapse or its early decline misses a closed form, the model is wrong; if the shuffled arm keeps producers, space was not the cause.
- Round two, after round one missed, swept the benefit-to-cost ratioDefinition: benefit-to-cost ratio social evolution The benefit b that one producer's goods give in total divided by the cost c it pays, written b/c. Excludes the net payoff to any one cell, which also depends on its neighbours. full definition from 5 to 16 at of 1, 2 and 4 and forecast that persistence would begin between ratios of 7 and 12. Its kill conditions: a mean-field error above 0.03, or a shuffled arm that keeps producers.
- Round three, after reading round two's control, ran goods to others only beside the old version, at ratios from 2 to 400. It had no kill condition: it said in advance that whatever it gave would be the report.
The SHA-256 of each preregistration is in the reproduction section.
Data and provenance
No external data were used. The model and all its numbers are our own and invented for the check. It describes no organism. Every number in this paper is read from the three rounds' result files.
Methods
The model
A torus gridDefinition: torus grid simulation A square grid whose opposite edges are joined, so every cell has the same number of neighbours and there is no border. Excludes grids with edges, where border cells have fewer neighbours. full definition of 100 by 100 cells holds producers and cheaters, starting half and half at random. Let be 1 for a producer and 0 for a cheater. A cell's fitness is
floored at a small positive value, where is the share of producers in the cell's goods boxDefinition: goods box our usage for this study The square of cells over which one producer's goods are spread, 3 by 3 at range 1 and 5 by 5 at range 2. Excludes the 3 by 3 window from which parents are drawn, which stays fixed. full definition. Each generation is a synchronous updateDefinition: synchronous update simulation Every cell of the grid is replaced at once in each generation, from the fitnesses of the previous generation. Excludes asynchronous updating, where one cell at a time is replaced. full definition by fitness-proportional replacementDefinition: fitness-proportional replacement evolutionary dynamics The update rule in which a cell's next occupant is copied from a parent drawn with chance in proportion to the parent's fitness, here among the 3 by 3 window around the cell including the cell itself. Excludes other update rules, such as death followed by birth from neighbours only, or imitation of the best neighbour. full definition: every cell's next occupant is copied from a parent drawn from the 3 by 3 window around the cell, the cell included, with chance in proportion to fitness.
In rounds one and two the producer share counts the cell itself:
where is the number of producers in the box, the cell included, and the number of cells in the box, 9 for a 3 by 3 box. In round three, goods reach others only:
Arms
The local arm uses the rules above. The mixed armDefinition: mixed arm our usage for this study The version of the model in which every cell gains from the producer share of the whole population and parents are drawn from the whole population, so neighbours mean nothing. Excludes any spatial structure. full definition sets to the producer share of the whole grid and draws parents from the whole grid. The shuffled armDefinition: shuffled arm our usage for this study The version of the model in which all positions are shuffled at random before each generation and the local rules then apply, so neighbours are strangers. Excludes the clustering of relatives that the local arm allows. full definition shuffles all positions before each generation and then applies the local rules, so neighbours are strangers.
The flaw
Under eq. 2 a producer is one of the cells its own goods reach, so it receives of its own output. Producing then pays the producer directly whenever
that is, whenever exceeds , which is 9 for a 3 by 3 box. That is a private return. It needs no relatives nearby, so it survives in the shuffled arm too. In round three it did so from a ratio of 20 (a share of 0.37) and fully from 30; at ratios of 12 and 16 the shuffled producers ended at 0.00 while local producers ended at 1.00, so in that band clustering still mattered.
Measures
The final producer shareDefinition: final producer share our usage for this study The share of producers in the grid at the end of a run, averaged over the replicate runs. A run stops early when one type takes the whole grid. Excludes the share of runs in which producers survived. full definition is the share of producers at the end of a run, averaged over replicate runs; a run stops early when one type fills the grid. A ratio counts as persistence when that average reaches 0.5. Round one ran 1,500 generations and 8 replicates; round two 1,200 generations and 6 replicates; round three 1,000 generations and 5 replicates.
Controls and planted checks
The shuffled arm is the controlDefinition: control statistics and experimental design A version of the data with the structure under test removed (for example shuffled or pooled), scored the same way as the real data, so the real score has something to beat. Excludes a comparison with a different dataset or with a published number. full definition on which the study turns. If space is what keeps producers alive, removing space must make them collapse. Rounds two and three ran it 20 times at the most favourable setting.
- dataGrid of producers and cheatersProducers pay a cost c to make a good worth b, shared over a 3 by 3 box of cells. Cheaters pay nothing.
- measurementRound two: threshold at ratio 9Local producers first reached a share of 0.5 at b/c of 9, at every b tried.
- controlShuffled control: 0.37Positions shuffled every generation, so neighbours are strangers. It should fall to 0. Mean of 20 runs at a ratio of 20.
- measurementCause: a ninth of its own goodThe box counted the producer itself, so producing paid back b/9. That beats the cost once b/c passes 9, with no neighbours needed.
- measurementRound three: goods to others onlyThe producer is taken out of its own box. Both versions run side by side up to a ratio of 400.
- rule set in advanceRule: local share reaches 0.5 at some ratioFixed before round three ran.
- failedCooperation persists with goods to others onlyHighest local share 0.48, at a ratio of 400.
Read from round2-result.json, run 20261031T084103Z. SHA-256 of the run's file 7c14e88710498618063304ef67915af5a1b3883c10a08d1604570ee1affa00c8 and of the published copy a3ed3283970b3f8d310323df85eab2e0be5f68cfb70d7fc2214d3745f811d855. In the copy, file paths are cut to the file name and the layout (indentation, line endings) may differ; every value is the same.
Read from round3-result.json, run 20261031T085106Z. SHA-256 of the run's file f2d77eedf9b8d74fbe176f5c3330b42ae6a774824ed52df9ae4eaeabc13bb739 and of the published copy 33236c81ceff178af36767107e700b23375ca623809cf6b78c4feb40e92ea6bb. In the copy, file paths are cut to the file name and the layout (indentation, line endings) may differ; every value is the same.
Round two added a known answer for the mixed arm. Producers have fitness and cheaters , where is the producer share, so the mean-field recursionDefinition: mean-field recursion population genetics An exact formula for next generation's producer share in the mixed arm, used here as a known answer the simulation must match. Excludes the local and shuffled arms, which have no such formula. full definition is
The simulated mixed arm, on a 300 by 300 grid averaged over 8 runs, had to match it within 0.03 over the first 20 generations. It did, with a maximum error of 0.0019.
Round one's known answer for the mixed arm was a closed-form slope for the early decline of the producer share on the log-odds scale. It failed, with an error of 0.117 against a bar of 0.05. The closed form was our mistake: it held the producer share fixed at one half while the share fell. Round two replaced it with eq. 5.
Results
Round one
At of 2 and of 0.3, a ratio of 6.7, local producers collapsed in every run, against our forecast of a final share of 0.6. The mixed and shuffled arms collapsed too. The cost sweep at of 2 kept producers at of 0.1 and 0.2, ratios of 20 and 10, and lost them from 0.3 up. Read with eq. 4, that pattern already fits the flaw.
Round two
Figure 1 shows the threshold. Local producers first reached a final share of 0.5 at a ratio of 9 for every value of : 0.52 at of 1, 0.66 at 2 and 0.88 at 4. We had forecast 7 to 12 from the rule that cooperation wins when the ratio exceeds the number of neighbours, 8 here, and counted it a pass.
The control did not hold. The shuffled control, which should have collapsed, kept producers at a mean share of 0.37 (95th percentile 0.52), and with a 3 by 3 goods box a producer recovers a ninth of its own output, so producing paid for itself whenever the benefit-to-cost ratio passed 9. The control ran at a ratio of 20 with 20 draws; its 5th percentile was 0.26. The same round's goods-range sweep at a ratio of 20 kept producers at range 1 and lost them at range 2, where the box holds 25 cells and the private return falls below . The threshold was the size of the goods box.
final producer share (1 means producers took the grid)
benefit-to-cost ratio b/c
- b = 1
- b = 2
- b = 4
- 0.5, the persistence bar
Data behind chart 2 9 rows
| Ratio b/c | b = 1 | b = 2 | b = 4 |
|---|---|---|---|
| 5 | 0.000 | 0.000 | 0.000 |
| 6 | 0.000 | 0.000 | 0.000 |
| 7 | 0.000 | 0.000 | 0.000 |
| 8 | 0.000 | 0.000 | 0.000 |
| 9 | 0.523 | 0.662 | 0.877 |
| 10 | 0.977 | 1.000 | 1.000 |
| 12 | 1.000 | 1.000 | 1.000 |
| 14 | 1.000 | 1.000 | 1.000 |
| 16 | 1.000 | 1.000 | 1.000 |
Read from round2-result.json, run 20261031T084103Z. SHA-256 of the run's file 7c14e88710498618063304ef67915af5a1b3883c10a08d1604570ee1affa00c8 and of the published copy a3ed3283970b3f8d310323df85eab2e0be5f68cfb70d7fc2214d3745f811d855. In the copy, file paths are cut to the file name and the layout (indentation, line endings) may differ; every value is the same.
final producer share (0 means cheaters took the grid)
- local producers
- shuffled control, 5th to 95th percentile
- control mean
Data behind chart 3 6 rows
| Quantity | Value |
|---|---|
| Local final share | 1.000 |
| Mixed final share | 0.000 |
| Shuffled control mean | 0.370 |
| Shuffled control 5th percentile | 0.258 |
| Shuffled control 95th percentile | 0.518 |
| Shuffled control runs | 20 |
Read from round2-result.json, run 20261031T084103Z. SHA-256 of the run's file 7c14e88710498618063304ef67915af5a1b3883c10a08d1604570ee1affa00c8 and of the published copy a3ed3283970b3f8d310323df85eab2e0be5f68cfb70d7fc2214d3745f811d855. In the copy, file paths are cut to the file name and the layout (indentation, line endings) may differ; every value is the same.
Round three
Table 1 and Figure 2 give the side-by-side run at of 2. With self-benefit put back, local producers reached a share of 0.70 at a ratio of 9 and 1.0 from 12 up, and shuffled producers reached 1.0 from a ratio of 30 up. The artefact reproduced.
c3 observed, evidence for claim 3
- The numbers in claim 3
- 0.70; 9; 1.0; 12; 30 matches the result file, 2026-11-09
- Chart 4
- Round three at b of 2: the same model with and without the producer's own share.
- Basis
- observed: measured in this study, with a result file
final producer share (1 means producers took the grid)
Own goods included
Goods to others only, and the mixed arm
benefit-to-cost ratio b/c, log scale
- Local
- Shuffled
- Mixed
- 0.5, the persistence bar
Data behind chart 4 11 rows
| Ratio b/c | Local, own goods included | Shuffled, own goods included | Local, others only | Shuffled, others only | Mixed |
|---|---|---|---|---|---|
| 2 | 0.000 | 0.000 | 0.000 | 0.000 | 0.000 |
| 5 | 0.000 | 0.000 | 0.000 | 0.000 | 0.000 |
| 9 | 0.702 | 0.000 | 0.000 | 0.000 | 0.000 |
| 12 | 1.000 | 0.000 | 0.000 | 0.000 | 0.000 |
| 16 | 1.000 | 0.000 | 0.000 | 0.000 | 0.000 |
| 20 | 1.000 | 0.370 | 0.000 | 0.000 | 0.000 |
| 30 | 1.000 | 1.000 | 0.000 | 0.000 | 0.000 |
| 50 | 1.000 | 1.000 | 0.000 | 0.000 | 0.000 |
| 100 | 1.000 | 1.000 | 0.028 | 0.000 | 0.000 |
| 200 | 1.000 | 1.000 | 0.185 | 0.000 | 0.003 |
| 400 | 1.000 | 1.000 | 0.483 | 0.000 | 0.038 |
Read from round3-result.json, run 20261031T085106Z. SHA-256 of the run's file f2d77eedf9b8d74fbe176f5c3330b42ae6a774824ed52df9ae4eaeabc13bb739 and of the published copy 33236c81ceff178af36767107e700b23375ca623809cf6b78c4feb40e92ea6bb. In the copy, file paths are cut to the file name and the layout (indentation, line endings) may differ; every value is the same.
With goods paid to others only, local producers ended at a share of 0.03 at a benefit-to-cost ratio of 100, 0.19 at 200 and 0.48 at 400, and never reached the preregistered bar of 0.5. Mixed producers ended at 0.04 or less at every ratio, and shuffled producers with goods to others only ended at zero at every ratio.
c4 observed, evidence for claim 4
- The numbers in claim 4
- 0.04 matches the result file, 2026-11-09
- Chart 4
- Round three at b of 2: the same model with and without the producer's own share.
- Basis
- observed: measured in this study, with a result file
| Rule set in advance | Value | Bar | Result |
|---|---|---|---|
| Round 2: mixed arm matches the known recursion, largest error below 0.03 | 0.0019 | 0.030 | held |
| Round 2: mixed producers end below 0.01 | 0.000 | 0.010 | held |
| Round 2: local producers end above 0.8 at a ratio of 20 | 1.000 | 0.800 | held |
| Round 2: local share above the shuffled control's 95th percentile | 1.000 | 0.518 | held |
| Round 2: lowest threshold ratio at least 7 | 9 | 7 | held |
| Round 2: highest threshold ratio at most 12 | 9 | 12 | held |
| Round 2: producers end below 0.05 at the widest goods range | 0.000 | 0.050 | held |
| Round 2: local producer lawn holds above 0.8 against a cheater patch | 1.000 | 0.800 | held |
| Round 2: mixed producer lawn falls below 0.05 against a cheater patch | 0.500 | 0.050 | failed |
| Round 3: shuffled producers with own goods pass 0.5 at the top ratio | 1.000 | 0.500 | held |
| Round 3: mixed producers end below 0.05 at the top ratio | 0.038 | 0.050 | held |
| Round 3: local producers, others only, persist at one ratio or more | 0 | 1 | failed |
| Round 3: local share, others only, above the shuffled control's 95th percentile | 0.483 | none | untestable |
Data behind chart 5 13 rows
| Rule set in advance | Value | Bar | Result |
|---|---|---|---|
| Round 2: mixed arm matches the known recursion, largest error below 0.03 | 0.0019 | 0.030 | held |
| Round 2: mixed producers end below 0.01 | 0.000 | 0.010 | held |
| Round 2: local producers end above 0.8 at a ratio of 20 | 1.000 | 0.800 | held |
| Round 2: local share above the shuffled control's 95th percentile | 1.000 | 0.518 | held |
| Round 2: lowest threshold ratio at least 7 | 9 | 7 | held |
| Round 2: highest threshold ratio at most 12 | 9 | 12 | held |
| Round 2: producers end below 0.05 at the widest goods range | 0.000 | 0.050 | held |
| Round 2: local producer lawn holds above 0.8 against a cheater patch | 1.000 | 0.800 | held |
| Round 2: mixed producer lawn falls below 0.05 against a cheater patch | 0.500 | 0.050 | failed |
| Round 3: shuffled producers with own goods pass 0.5 at the top ratio | 1.000 | 0.500 | held |
| Round 3: mixed producers end below 0.05 at the top ratio | 0.038 | 0.050 | held |
| Round 3: local producers, others only, persist at one ratio or more | 0 | 1 | failed |
| Round 3: local share, others only, above the shuffled control's 95th percentile | 0.483 | none | untestable |
Read from round2-result.json, run 20261031T084103Z. SHA-256 of the run's file 7c14e88710498618063304ef67915af5a1b3883c10a08d1604570ee1affa00c8 and of the published copy a3ed3283970b3f8d310323df85eab2e0be5f68cfb70d7fc2214d3745f811d855. In the copy, file paths are cut to the file name and the layout (indentation, line endings) may differ; every value is the same.
Read from round3-result.json, run 20261031T085106Z. SHA-256 of the run's file f2d77eedf9b8d74fbe176f5c3330b42ae6a774824ed52df9ae4eaeabc13bb739 and of the published copy 33236c81ceff178af36767107e700b23375ca623809cf6b78c4feb40e92ea6bb. In the copy, file paths are cut to the file name and the layout (indentation, line endings) may differ; every value is the same.
At a ratio of 400, widening the goods box lowered the others-only local share from 0.47 at range 1 to 0.18 at range 2, 0.21 at range 3 and 0.15 at range 5. These come from a separate set of 5 runs; the range 1 value of 0.47 is that set's counterpart of the 0.48 in Table 1.
The round-three shuffled control, with goods to others only at a ratio of 400, ended at zero in all 20 runs. The local arm's 0.48 is above every one of them. The preregistered verdict that compares the two was recorded as untestable, because the control's draws had no spread for a 95th percentile to mean anything.
Table 2 sets the forecasts against the outcomes.
Discussion
The second round looked like a textbook reproduction, and the shuffled control is what showed it was not one. Scrambling positions every generation removes relatives from a producer's neighbourhood, so any persistence that survives scrambling cannot come from kin. Producers kept a mean share of 0.37 in the scrambled grid. Reading that number led to eq. 4: the threshold of 9 was the size of the goods box, and the match with the neighbour count of 8 in the rule of Ohtsuki and colleagues [5] was a coincidence. Their rule concerns a game played between pairs of neighbours on a graph. Ours shares a public good over a box, a different model, so the match was never a test of their rule.
With the private return removed, local producers did not persist anywhere up to a ratio of 400, and widening the goods box made them worse off. This fits the result of Taylor [2] and of Griffin and colleagues [4]: when relatives compete for the same space, the competition can cancel the benefit of living near them. In our model the parent window and the goods box overlap, so a producer's goods feed the same neighbours that compete for its offspring's cells. The model does not show that space never protects cooperators. It shows that this model, with this update rule, gives them no protection at benefit-to-cost ratios up to 50.
Limitations
- One update rule, fitness-proportional and synchronous, with invented numbers. Other update rules, asynchronous timing, other neighbourhood sizes or a parent window separate from the goods box could let producers persist.
- The model describes no organism and says nothing about any real microbe.
- The ratio grid is coarse. Round three's threshold with own goods lies somewhere between ratios of 5 and 9, and round two's between 8 and 9.
- Few replicates: 5 per setting in round three. The others-only local share of 0.48 at 400 sits close to the 0.5 bar, and another 5 runs could fall on either side.
- The final share averages runs that mostly end at 0 or 1, so it tracks the share of runs won by producers more than any mixed state.
- The runs were scored by code and checked by the same analyst who wrote them, with no outside review.
Evidence
Prediction failed. With goods paid to others only, local producers never reached the preregistered mean share of 0.5 (0.48 at a benefit-to-cost ratio of 400).
Figures
These are the paper's own figures, numbered as in the PDF, and each "Figure" reference in the text points here. The charts on this page redraw the same results from the result files and carry their own numbers.
Tables
| Ratio | Local, own goods included | Shuffled, own goods included | Local, others only | Shuffled, others only | Mixed |
|---|---|---|---|---|---|
| 2 | 0 | 0 | 0 | 0 | 0 |
| 5 | 0 | 0 | 0 | 0 | 0 |
| 9 | 0.70 | 0 | 0 | 0 | 0 |
| 12 | 1.00 | 0 | 0 | 0 | 0 |
| 16 | 1.00 | 0 | 0 | 0 | 0 |
| 20 | 1.00 | 0.37 | 0 | 0 | 0 |
| 30 | 1.00 | 1.00 | 0 | 0 | 0 |
| 50 | 1.00 | 1.00 | 0 | 0 | 0 |
| 100 | 1.00 | 1.00 | 0.028 | 0 | 0 |
| 200 | 1.00 | 1.00 | 0.185 | 0 | 0.003 |
| 400 | 1.00 | 1.00 | 0.483 | 0 | 0.038 |
| Round and quantity | Forecast | Outcome |
|---|---|---|
| One: local final share at ratio 6.7 | 0.6 | 0 |
| One: cost at which local collapses | near 0.6 | 0.3 |
| Two: first ratio with persistence | 7 to 12 | 9 at every b |
| Two: local final share at ratio 20 | above 0.8 | 1.0 |
| Two: mixed lawn invaded by a cheater patch | below 0.05 | 0.5 |
| Three: threshold with own goods included | 9 | 9 |
| Three: shuffled with own goods persists above 9 | yes | from 30; 0.37 at 20; 0.00 at 12 and 16 |
| Three: mixed and shuffled collapse, others only | yes | yes |
| Three: others-only local never persists up to 400 | probability 0.4 | it did not persist |
Appendix A. The preregistered verdicts
Each verdict is a set of rules written before its round. A verdict passes only when every rule holds. Values are read from the result files.
| Round and verdict | Deciding rule | Value | Holds |
|---|---|---|---|
| One: mixed collapses | mixed final share below 0.01 | 0 | yes |
| One: slope matches | slope error below 0.05 | 0.117 | no |
| One: shuffled collapses | shuffled final share below 0.05 | 0 | yes |
| One: space keeps producers | persistence in at least half the runs and above the shuffled 95th percentile | 0 | no |
| One: range fails | final share at range 25 below 0.05 | 0 | yes |
| One: invasion resisted | local lawn above 0.3 and mixed lawn below 0.05 | 0.75; 0.125 | no |
| Two: recursion matches | maximum error below 0.03 | 0.0019 | yes |
| Two: mixed collapses | mixed final share below 0.01 | 0 | yes |
| Two: space keeps producers | local above 0.8 and above the shuffled 95th percentile (0.52) | 1.0 | yes |
| Two: threshold near 8 | first persistence ratio from 7 to 12 at every b | 9 | yes |
| Two: range fails | final share at range 25 below 0.05 | 0 | yes |
| Two: invasion resisted | local lawn above 0.8 and mixed lawn below 0.05 | 1.0; 0.5 | no |
| Three: artefact shown | shuffled with own goods above 0.5 at ratio 400 | 1.0 | yes |
| Three: mixed collapses | mixed final share below 0.05 at ratio 400 | 0.038 | yes |
| Three: others only persist somewhere | some ratio with final share of at least 0.5 | none | no |
| Three: space credited | local others-only above the shuffled 95th percentile | 0.48 against 0 | untestable |
Round two's two passing verdicts on space and on the threshold were produced by the flaw described in the methods, and round three withdrew them.
What lowers it
- scoring Scored by code and by the agent that ran it; self-graded. from our publication register, on who scored it
- depth of reading The cited literature was read at the level of abstracts and publisher pages; full texts were not read. from the Verified section
What holds it up
- preregistration Preregistered and hash-locked before the run (sha256 40a99201). from the Reproduce section
Where the claim stands
- lead
- hypothesis
- thesis
- conjecture
- theorem
- law candidate
- killed
Our reproduction of the cheater result: it was self-benefit. Tier D: Our reproduction turned out to rest on producers benefiting from their own goods; the corrected result is a null under one update rule.
Trail
Versions
- v3 2026-11-14, this page corrected, 1 item; the PDF and its BuildTeX source are still paper version 1.0
- v2 2026-11-09, paper version 1.0, first published PDF sha256 f7c998c6f2d48600
- v1 2026-10-31, entered in the findings ledger
Corrections
2026-11-14 scope found by a review of the published pages
A review of the published page found wording that the round-three result file narrows. now The page said the private return survives in the shuffled arm above a ratio of 9; in the file shuffled producers with their own goods ended at 0.00 at ratios of 12 and 16, 0.37 at 20 and 1.00 from 30, while local producers ended at 1.00 from 12. The methods and the forecast table now give those values, and one chart caption now says space is not the only thing that keeps producers alive. The phrase sensible cost is replaced by the ratios it stood for.
2026-11-09 wording found by the publication pass
Our earlier write-up said local producers in round two "persisted in the majority of runs" at a ratio of 9. now The rule was a mean final share of at least 0.5, and this paper says so. It also did not report that round three's space verdict was recorded as untestable; this paper does.
2026-10-31 wording found by the study itself, before publication
Round one's closed-form slope check failed because the formula held the producer share fixed. now Round two replaced it with the exact recursion.
2026-10-31 retraction found by the study itself, before publication
Round two was first read as reproducing the kin-and-space result, with a threshold credited to the neighbour rule of Ohtsuki and colleagues. now The threshold came from producers receiving their own goods. Round three tested this and the reading was withdrawn.
Each correction is a dated note; the findings ledger is never rewritten, and a note governs where it differs.
Ledger and version dates up to publication are local dates in US Pacific time. Clock times in the text are UTC, seven or eight hours ahead, so a lock or a run stamped just after midnight UTC belongs to the previous local day. Corrections from 14 November 2026 on are dated in UTC.
References
- Nadell, C. D., Drescher, K. and Foster, K. R. (2016). Spatial structure, cooperation and competition in biofilms. Nature Reviews Microbiology 14(9), 589-600. doi:10.1038/nrmicro.2016.84 abstract or summary, 2026-11-09: abstracts and publisher pages; full text not read used in Introduction, Discussion
- Taylor, P. D. (1992). Altruism in viscous populations: an inclusive fitness model. Evolutionary Ecology 6, 352-356. doi:10.1007/BF02270971 abstract or summary, 2026-11-09: abstracts and publisher pages; full text not read used in Introduction, Discussion
- Wilson, D. S., Pollock, G. B. and Dugatkin, L. A. (1992). Can altruism evolve in purely viscous populations? Evolutionary Ecology 6, 331-341. doi:10.1007/BF02270969 abstract or summary, 2026-11-09: abstracts and publisher pages; full text not read used in Introduction
- Griffin, A. S., West, S. A. and Buckling, A. (2004). Cooperation and competition in pathogenic bacteria. Nature 430, 1024-1027. doi:10.1038/nature02744 abstract or summary, 2026-11-09: abstracts and publisher pages; full text not read used in Introduction, Discussion, Discussion
- Ohtsuki, H., Hauert, C., Lieberman, E. and Nowak, M. A. (2006). A simple rule for the evolution of cooperation on graphs and social networks. Nature 441, 502-505. doi:10.1038/nature04605 abstract or summary, 2026-11-09: abstracts and publisher pages; full text not read used in Introduction, Discussion
Cited by later findings
- No later record in the findings ledger treats this finding.
Reproduce
Preregistration
sha256 40a9920161815ca8341b659c890d121cae7bb9668eb84f625054a5a44654177c
plan 654439252dcf316de5ffa21bb074a7accf9e903f79e78ef58b47ef87c31c8203
Steps
- Build a 100 by 100 torus of producers and cheaters, half and half at random.
- Give each cell the fitness of eq. 1 with the producer share of eq. 3, so a producer gains nothing from its own goods. Replace every cell each generation by a parent drawn from its 3 by 3 window in proportion to fitness.
- Run 1,000 generations, 5 replicates per setting, at of 2 and ratios from 2 to 400, with the local, shuffled and mixed arms, and repeat with eq. 2 to see the artefact.
- Check the mixed arm against eq. 5.
- Round three preregistration SHA-256: 40a9920161815ca8341b659c890d121cae7bb9668eb84f625054a5a44654177c. Plan SHA-256: 654439252dcf316de5ffa21bb074a7accf9e903f79e78ef58b47ef87c31c8203. Run 20261031T085106Z, seed 20261062.
- Round two preregistration SHA-256: 156dfcf54e061acb39e5f34a1e7a6e6673dbc8e547add3a7ba18cb40bf762dc1. Plan SHA-256: cf4fcd9b6c9847bb63fcb60b696dbda0dfb56ee59fcdad675779f7b0b2790731. Run 20261031T084103Z, seed 20261061.
- Round one preregistration SHA-256: 8b31350baad5d1520dfb9044c0252f65ab0bc2a909f8720a975ca276a1a7cc52. Plan SHA-256: c0077cdc4144e2cc160c49bd2ad6ea9694592d5168b127cffb01a282900cddec. Run 20261031T083720Z, seed 20261051.
Cost. The timing records give 54, 236 and 131 seconds for rounds one, two and three on one desktop CPU. The study was not re-run for this paper.
Downloads
- Whitepaper, PDF F190.pdf, 477 KB
- BuildTeX source F190.bld, 30 KB
- Build receipt F190.buildtex.json, 1 KB
- BuildLang doc module doc.bld, 5 KB, imported by the source
The PDF is typeset by BuildTeX from F190.bld, which is written from the same source as this page. The receipt records the source's SHA-256 and the PDF's (f7c998c6f2d4), so anyone can rebuild it and compare. The copy here has its hidden author field blanked, as the site does for every file it publishes; blank the same field in a rebuild before comparing. The name stays on the first page.
Verified
Verified on 2026-11-09. On 9 November 2026 every final share, threshold, sweep value, control mean, percentile and p value, the recursion error and the slope error in this paper were re-read from the three rounds' result files, and the headline values match the findings ledger. Grid size, generations, replicates, ratio grids and range grids were read from each round's build file, and the fitness rules from the model code. Each preregistration's SHA-256 was recomputed from the locked file and matches the hash recorded in its result file. Both figures were drawn by a script that reads only the round two and round three result files.
Not checked. The study was not re-run for this paper. The literature in the introduction was found by searches run on 9 November 2026 and read at the level of abstracts and publisher pages; the full texts of the cited papers were not read.
Terms on this page
Each term is defined where it is first used on this page. Each name below opens its entry in the findings glossary, which lists every page that uses it.
- public good social evolution and economics first use
- producer and cheater social evolution first use
- local competition social evolution, after Taylor and after Griffin and colleagues first use
- preregistration research method (metascience) first use
- kill condition research method (our usage, after Popper's falsification) first use
- benefit-to-cost ratio social evolution first use
- torus grid simulation first use
- goods box our usage for this study first use
- synchronous update simulation first use
- fitness-proportional replacement evolutionary dynamics first use
- mixed arm our usage for this study first use
- shuffled arm our usage for this study first use
- final producer share our usage for this study first use
- control statistics and experimental design first use
- mean-field recursion population genetics first use
To report an error, name the finding, the claim number and the source on the Work page, which gives the address. Accepted corrections join the Trail with their date.