
Findings F149 Society and economics, Plants, trees and earth, Biology and medicine, Method and statistics found 2026-10-31
Did unsupported citations about fungal networks double? It depends on the weighting
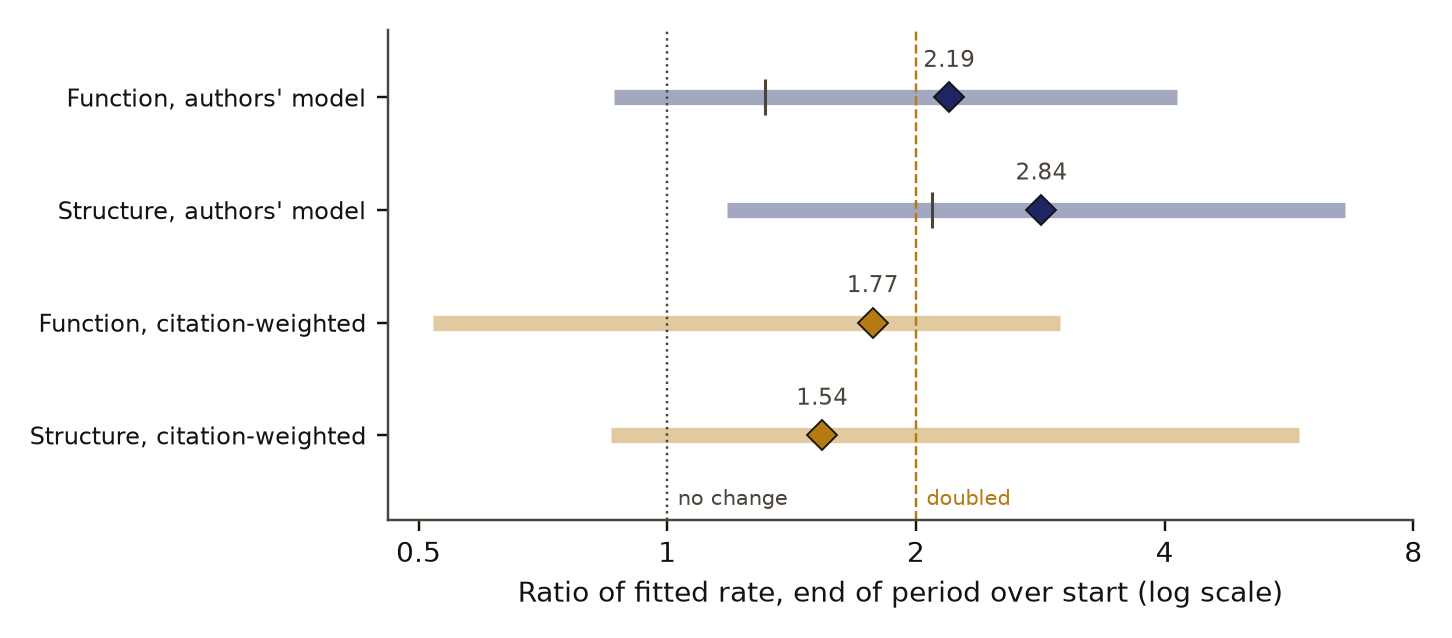
A 2023 paper reported that citations overstating the evidence for forest fungal networks roughly doubled over time. On the authors' own deposited table, their model gives about 2.2 and 2.8 times, while weighting each year by its number of citations gives about 1.8 and 1.5, and only one of the four intervals clears 1.
- Tier
- B*, strong signal
- Outcome
- held
- Rung
- hypothesis
- Verdicts
- 7 passed, 3 failed
- Corrections
- 3, latest 2026-11-14
- Version
- v3, 2026-11-14
- Redo it
- Reproduce
Download PDF 536 KB BuildTeX source F149.bld
What this means for a reader
If you repeat that misleading citations about forest fungal networks doubled, say "rose, and about doubled on the authors' model", with the interval beside it. The rise is real inside the studies that were cited. How large it is depends on whether a year with one citation counts as much as a year with thirty, and with 18 focal studies the uncertainty stays wide either way. Nothing here bears on whether the networks exist or move resources between trees.
Objection
Rebuilt denominators with zero-rate years sharing the remainder; the definition of doubled with Fig. 3 unread; the abstract's 25 and almost 50 percent endpoints not compared.
What would change the call. Blind rerun by an independent analyst, true denominators from Karst, and a read of Fig. 3 before calling any definition theirs.
From the strongest objection recorded in our publication register.
Abstract
Karst, Jones and Hoeksema reported in 2023 that citations crediting forest fungal network studies with more than their results support had doubled in the past 25 years. That sentence is now part of a public dispute. We reran the claim on the table the authors deposited, under a plan hash-locked before the table was analysed. The table holds 268 study-year rates for 11 focal studies on network function and 7 on network structure, and no denominators, which we rebuilt from the paper's supplement. On the authors' negative binomial model, unsupported citations rose by a factor of 2.19 for network function (0.86 to 4.14) and 2.84 for network structure (1.18 to 6.62). Weighted by citations, the rise was 1.77 for function (0.52 to 2.99) and 1.54 for structure (0.85 to 5.81), and neither interval excludes 1. Inside individual focal studies the rate rose for both: 3.0 times for function (p 0.001) and 3.5 times for structure (p 0.009). With this many focal studies, a true doubling gives an interval clear of 1 only 0.425 of the time, so an interval that includes 1 is no evidence against doubling. "Doubled" fairly describes our refit of the authors' model; their own fitted curve was not available to us. Counted as a share of all citations the rise is smaller and less certain.
c1 observed, evidence for claim 1
- The numbers in claim 1
- 2.19; 0.86; 4.14; 2.84; 1.18; 6.62 matches the result file, 2026-11-09
- Chart 1
- The design: three models of the same rise, a shuffle control and a planted doubling.
- Chart 2
- How much unsupported citations rose, on three models.
- Basis
- observed: measured in this study, with a result file
c2 observed, evidence for claim 2
- The numbers in claim 2
- 1.77; 0.52; 2.99; 1.54; 0.85; 5.81; 1 matches the result file, 2026-11-09
- Chart 4
- Share of citations that were unsupported, by citing year, pooled over focal studies.
- Basis
- observed: measured in this study, with a result file
c3 observed, evidence for claim 3
- The numbers in claim 3
- 3.0; 0.001; 3.5; 0.009 matches the result file, 2026-11-09
- Chart 3
- The rise inside single focal studies, against the same data with years shuffled.
- Basis
- observed: measured in this study, with a result file
c4 observed, evidence for claim 4
- The numbers in claim 4
- 1; 0.425 matches the result file, 2026-11-09
- Chart 5
- How often the method calls a rise when the truth is planted.
- Basis
- observed: measured in this study, with a result file
Introduction and motivation
A common mycorrhizal networkDefinition: common mycorrhizal network forest ecology and mycology A set of fungal threads that colonise the roots of two or more plants at once and so may link them below ground. Excludes claims about what such a network does, such as moving carbon or signals between trees, which are the matters in dispute. full definition is a set of fungal threads that colonise the roots of two or more plants at once. Popular accounts have described such networks as channels through which trees share carbon and warnings. Karst, Jones and Hoeksema [1] reviewed the field evidence and the way it is cited. They read the later citations of 18 field studies, which we call focal studiesDefinition: focal study our usage, following Karst and colleagues One of the 18 field studies on these networks whose later citations the original authors read and coded, 11 on network function and 7 on network structure. Excludes the citing papers, which are the units counted inside each focal study. full definition, and coded each citation as supported or not by what the focal study found. In their abstract they report that unsupported citationsDefinition: unsupported citation citation analysis, as coded by Karst and colleagues A citation that credits a focal study with a claim that the original authors judged the study's results do not support. Excludes any judgement of ours: every coding in this paper is the original authors'. full definition "have doubled in the past 25 years". An Author Correction followed [2].
The paper drew replies. Klein and colleagues [4] accepted that some of its criticism is justified and argued that evidence for carbon transfer between trees through these networks is solid and growing. Simard, Ryan and Perry [5] replied to three of its critiques; among other points they called its rationale for counting citations by year vague. Neither reply, as far as we read them at abstract and summary level, reanalysed the deposited numbers.
The doubling figure is a statistic, and the authors deposited the table behind it under CC0. That makes it checkable at low cost. Our question was narrow: on that table, does the rate of unsupported citations double over the study period for both kinds of claim, and does the answer hold when each year is weighted by how many citations it holds? The decision the reread informs is how our own work may quote the figure. Searches run on 9 November 2026 for a numeric reanalysis of the deposit returned none. That is what the searches returned; it does not show that none exists.
Preregistration and design
The preregistrationDefinition: preregistration research method (metascience) A dated written plan for a study, fixed and hash-locked before any result is seen: the question, the data, the statistic, the controls, the forecasts and the kill conditions. Excludes a plan revised after looking at the outcome, and a protocol written only for the record after the run. full definition was hash-locked at 06:07:12 UTC on 31 October 2026, before the table was analysed. It was not blind, and it lists what had been seen: the deposit's metadata in full, the header row of the table, and one data row printed by accident while checking the header. From an earlier reading of ours we also knew the per-year numerators in the paper's supplementary Note 3 and the method in its Note 2: a negative binomial regression of the percentage on indexed year. The article body and its main figure were behind a paywall and unread, so the authors' fitted curve and their own definition of doubled were not available to us.
The plan fixed a definition. Doubled means: the ratio of the fitted rate at the end of each group's span to the fitted rate at its start has a 95 percent interval, from resampling focal studies, that excludes 1 and covers 2, and the point estimate beats year-shuffled rates. Function and structure are read separately.
The plan named five measures, set out in the methods, with a verdictDefinition: verdict research method (our usage) The pass or fail of one preregistered rule set against the run's numbers, read off by code. Excludes an interpretation written after reading the numbers. full definition for each and a calibration on planted data. Kill conditionsDefinition: kill condition research method (our usage, after Popper's falsification) A rule written in the preregistration that, when met, decides against the claim with no room for judgement after the run. Excludes reasons found after the run for setting a result aside. full definition, without discretion:
- If the calibration fails, no doubling verdict stands.
- If the authors' model fails in both groups, the fitted curve does not support doubling on this table.
- If the authors' model passes and the within-study model fails, the rise comes from a change in which studies are cited.
- If the citation-weighted model fails beside a pass of the authors' model, the rise depends on thin early years.
The plan also recorded our own forecasts, set against the outcomes in Table 2.
Data and provenance
The data are the authors' Dataverse deposit [3], released under CC0. Its table gives, for each focal study and each citing year, the study-year rateDefinition: study-year rate our usage for the deposited table The share of one focal study's citations in one calendar year that were coded unsupported, as stored in the deposit without its denominator. Excludes a count of citations, which the deposit does not hold. full definition of unsupported citations. A "Count" column holds 100 times the rate, a percentage. The file holds 272 rows; 4 had a blank rate and were skipped and counted, leaving 268 rates: 158 for 11 function studies over 1997 to 2022 and 110 for 7 structure studies over 1999 to 2022. The year 2022 is incomplete.
The table holds no denominators. We built each rebuilt denominatorDefinition: rebuilt denominator our usage in this study The number of citations a focal study received in a year, recovered by finding the whole number n for which a published count k gives the deposited rate k over n. Excludes a count read directly from any source; years with a rate of zero share what remains of the study's total and are the least certain. full definition from the per-year numerators printed in the paper's supplementary Note 3: for a nonzero rate and a known numerator , the whole number with rate . Where no whole number fits, the reduced fraction's denominator was used as a lower bound. Years with a rate of zero carry no numerator information and shared what remained of the study's reviewed total, the weakest step in the rebuild. The supplement is copyrighted, so this paper reports only derived values from it.
Methods
Integrity and rebuild
Two checks came first. The integrity check required the Count column to equal 100 times the rate, the expected numbers of studies, and group means of the yearly rate within 1.5 points of the means stated by the authors, 32.2 and 14.8 percent. The rebuild check required at least 0.7 of nonzero rates to give a whole-number denominator and a median gap of at most 0.2 between rebuilt numerators and the totals in the paper's tables. A failed rebuild would void only the citation-weighted measure.
The authors' model as deposited
Following Note 2, a negative binomial modelDefinition: negative binomial model statistics (count regression) A regression for counts whose variance can exceed their mean, fitted here with a log link so that the fitted rate changes by a fixed factor per year. Excludes models that weight each year by how many citations it holds. full definition with a log link was fitted to the percentage in each study-year on the indexed year , using every row including the incomplete 2022:
The ratio over a group's span (25 years for function, 23 for structure) is
The same fit without 2022 is reported beside it. This model gives every study-year equal weight, a year with one citation as much as a year with thirty.
Within study
New focal studies enter the pool over time, so a pooled rise could come from which studies are cited when. The within-study modelDefinition: within-study model statistics (fixed effects) A regression with its own baseline level for each focal study, so the year slope is estimated only from change inside studies. Excludes change that comes from which focal studies happen to be cited in early and late years. full definition gives each focal study its own level:
fitted as a quasi-Poisson fitDefinition: quasi-Poisson fit statistics (count regression) A log-linear count regression whose standard errors are scaled by the observed spread, used here for the within-study model. Excludes a full probability model for the counts. full definition. It passes if the slope is above 0 and above the 95th percentile of its year-shuffled control.
Citation-weighted
The citation-weighted share modelDefinition: citation-weighted share model statistics (logistic regression) A regression of the number of unsupported citations out of all citations in each study-year on the year, so a year with thirty citations counts thirty times as much as a year with one. Excludes the equal weight per study-year that a model of the deposited percentages gives. full definition fits the rebuilt count of unsupported citations out of in each study-year by a binomial logistic regression on year:
and reports the ratio of the fitted share at the last year to the share at the first:
Intervals and reported quantities
Intervals for the ratios come from study resamplingDefinition: study resampling statistics (cluster bootstrap) Drawing focal studies with replacement, refitting the model each time, and taking the middle 95 percent of the refitted ratios as the interval. Excludes resampling single study-years, which would ignore that citations of one study move together. full definition, because citations of one focal study move together. Reported without a verdict: the pooled share in each group's first ten years against 2012 to 2021, the rate in the first five indexed years against the last five up to 2021, and growth in total citations over the last five years against the five before.
Controls and planted checks
The year-shuffled controlDefinition: control statistics and experimental design A version of the data with the structure under test removed (for example shuffled or pooled), scored the same way as the real data, so the real score has something to beat. Excludes a comparison with a different dataset or with a published number. full definition permutes the rates across years inside each focal study, 1,000 times, and refits the authors' model and the within-study model. A real ratio or slope must beat the control's 95th percentile. Its p value is a p value from drawsDefinition: p value (from draws) statistics The share of control draws scoring at or above the real score, with one added to the count and to the number of draws, so it is never zero. Excludes a p value from a textbook formula that assumes a distribution. full definition, so with 1,000 draws the smallest possible value is 1 in 1,001.
- dataThe deposited rate table268 rates of unsupported citations, one per focal study and citing year, for 11 function and 7 structure focal studies.
- measurementRebuilt denominatorsThe table holds rates only. Citation counts were rebuilt from the paper's printed numerators. 143 of 169 nonzero rates gave a whole number.
- measurementThree modelsThe authors' count model with every study-year weighted equally, a within-study model with one level per focal study, and a share model weighted by citations.
- controlYears shuffled inside each study1000 shuffles. A real ratio or slope has to beat the 95th percentile of the shuffled ones.
- planted checkPlanted truth of 1 and of 2New counts drawn on the real studies, years and denominators, 120 simulations per truth.
- heldPlanted checkA flat truth was called a rise 0.092 of the time, limit 0.15. A doubling came back as 2.11 and was covered 0.89 of the time, above the bar of 0.8. The intervals claim 95 percent, so they run somewhat too narrow.
- failedDoubling, authors' model, functionRatio 2.19. The interval starts at 0.86, below 1.
- heldDoubling, authors' model, structureRatio 2.84. The interval starts at 1.18.
- heldRise inside studies, both groupsSlopes 0.044 and 0.054 per year, above the shuffle cuts.
- failedDoubling, citation-weighted, both groupsIntervals start at 0.52 and 0.85, below 1.
Read from result.json, run 20261031T060723Z. SHA-256 of the run's file 85c71a54d2d135758e9bba36dcee72af5c1955b93d8c1c4751194942edb34902 and of the published copy 5602861be65526e2ef1007c9ea2222a446b3326a50a38e39871ae98065636384. In the copy, file paths are cut to the file name and the layout (indentation, line endings) may differ; every value is the same.
The planted checkDefinition: planted check research method; called a positive control in experimental science Data built so that the right answer is known, run through the same analysis before the real data, to show that the analysis can see the effect when it is there. Excludes any check made on the real data, which cannot show what the analysis misses. full definition kept the real studies, years and rebuilt denominators and drew new counts from a known truth: a study effect (lognormal, standard deviation 0.4) and a true ratio of 1 or 2 over the span. It ran 60 simulations per group per truth, 120 per truth in all, with 150 study resamples each. The calibration passed if a flat truth was called a rise at most 0.15 of the time, the doubled truth gave a median ratio between 1.6 and 2.4, and its interval covered the truth at least 0.8 of the time.
The authors' stated means were recovered. Row means came out at 33.2 and 15.3 percent against the stated 32.2 and 14.8, within the 1.5 point allowance. The mean of study means gave 32.3 and 14.7, which identifies the definition the authors used.
The rebuild passed: 143 of 169 nonzero rates, 0.846, gave a whole-number denominator, and the rebuilt numerators matched the paper's table totals with a median gap of 0. The per-study totals are in Appendix B.
The calibration met its preregistered bar. With a flat truth the pipeline called a rise 0.092 of the time. With a doubled truth the median ratio was 2.11 and the interval covered the truth 0.89 of the time, against a bar of 0.8. The intervals are narrower than their stated level: they are 95 percent intervals, and they covered a planted doubling about 0.89 of the time where 0.95 was claimed. Read every interval on this page as somewhat too narrow. The calibration also measured statistical powerDefinition: statistical power statistics The chance that a test detects an effect of a given size when that effect is real, measured here on planted data with a known doubling. Excludes the chance that an effect is real given that the test detected it. full definition: with a true doubling, the interval excluded 1 only 0.425 of the time.
Results
On the authors' negative binomial model, unsupported citations rose by a factor of 2.19 for network function (0.86 to 4.14) and 2.84 for network structure (1.18 to 6.62). Both beat their year-shuffled controls. By the letter of the plan, function fails because its interval reaches below 1, and structure passes. Dropping the incomplete 2022 gave 2.26 and 2.43.
ratio of end rate to start rate, log scale
- network function
- network structure
- 95% interval from resampling focal studies. The within-study model has none in the run.
- no change, 1
- a doubling, 2
Data behind chart 2 2 rows
| Group | Authors' model | Low | High | Without 2022 | Citation-weighted | Low | High | Within study |
|---|---|---|---|---|---|---|---|---|
| Network function | 2.19 | 0.86 | 4.14 | 2.26 | 1.77 | 0.52 | 2.99 | 3.02 |
| Network structure | 2.84 | 1.18 | 6.62 | 2.43 | 1.54 | 0.85 | 5.81 | 3.46 |
Read from result.json, run 20261031T060723Z. SHA-256 of the run's file 85c71a54d2d135758e9bba36dcee72af5c1955b93d8c1c4751194942edb34902 and of the published copy 5602861be65526e2ef1007c9ea2222a446b3326a50a38e39871ae98065636384. In the copy, file paths are cut to the file name and the layout (indentation, line endings) may differ; every value is the same.
Inside individual focal studies the rate rose for both: 3.0 times for function (p 0.001) and 3.5 times for structure (p 0.009). The slopes, 0.044 and 0.054 per year, beat their shuffled cuts of 0.022 and 0.036. The rise does not come from which focal studies happen to be cited early and late.
within-study slope per year
- real slope
- shuffled years, 5th to 95th percentile
- control mean
- no trend, 0
Data behind chart 3 2 rows
| Group | Real slope per year | Ratio over the span | Span, years | Shuffled mean | Shuffled 5th | Shuffled 95th | p |
|---|---|---|---|---|---|---|---|
| Network function | 0.044 | 3.02 | 25 | 0.0003 | −0.020 | 0.022 | 0.001 |
| Network structure | 0.054 | 3.46 | 23 | 0.0001 | −0.042 | 0.036 | 0.009 |
Read from result.json, run 20261031T060723Z. SHA-256 of the run's file 85c71a54d2d135758e9bba36dcee72af5c1955b93d8c1c4751194942edb34902 and of the published copy 5602861be65526e2ef1007c9ea2222a446b3326a50a38e39871ae98065636384. In the copy, file paths are cut to the file name and the layout (indentation, line endings) may differ; every value is the same.
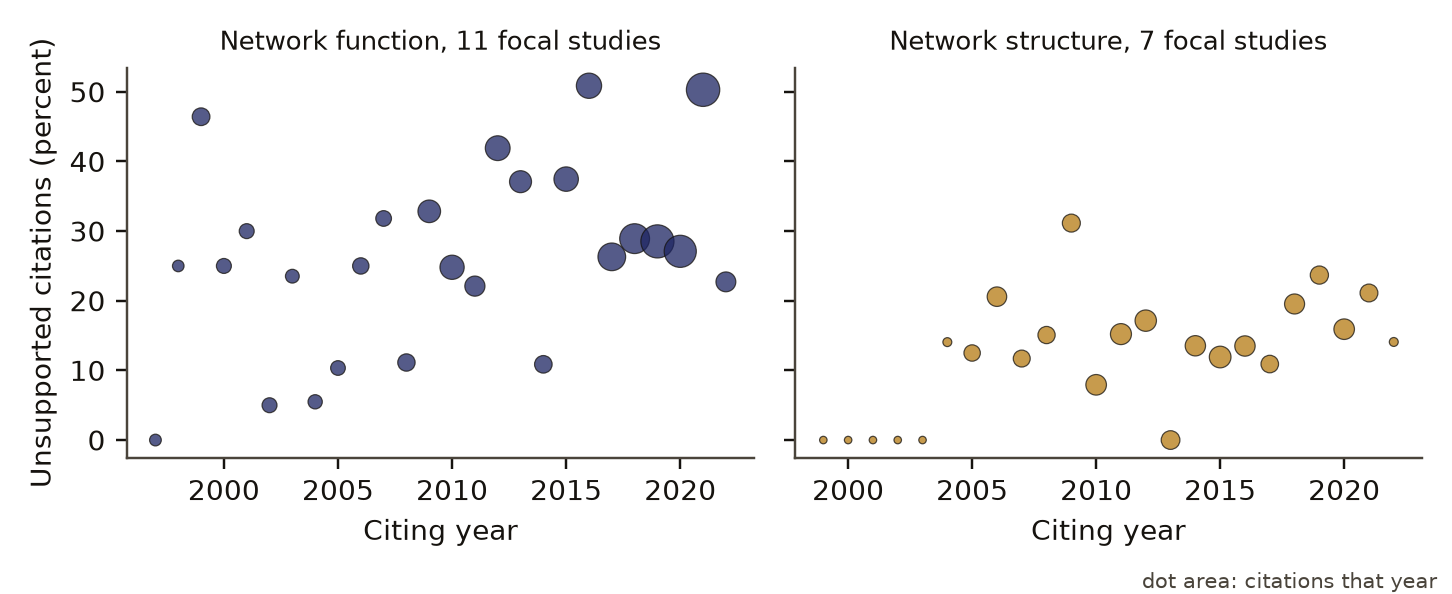
Weighted by citations, the rise was 1.77 for function (0.52 to 2.99) and 1.54 for structure (0.85 to 5.81), and neither interval excludes 1. The fitted share went from 0.205 to 0.363 for function and from 0.113 to 0.175 for structure. In pooled shares, function went from 21.5 percent in its first ten years to 34.9 percent in 2012 to 2021, about 1.6 times; structure went from 13.6 to 14.7 percent, about 1.1 times. Figure 2 shows why the weighting matters: the early structure years hold few citations each.
unsupported share, percent
citing year
- network function
- network structure
Data behind chart 4 50 rows
| Group | Year | Citations, rebuilt | Unsupported | Share, percent |
|---|---|---|---|---|
| Network function | 1997 | 12.3 | 0 | 0.0 |
| Network function | 1998 | 12.0 | 3 | 25.0 |
| Network function | 1999 | 28.0 | 13 | 46.4 |
| Network function | 2000 | 20.0 | 5 | 25.0 |
| Network function | 2001 | 20.0 | 6 | 30.0 |
| Network function | 2002 | 20.0 | 1 | 5.0 |
| Network function | 2003 | 17.0 | 4 | 23.5 |
| Network function | 2004 | 18.2 | 1 | 5.5 |
| Network function | 2005 | 19.3 | 2 | 10.3 |
| Network function | 2006 | 24.0 | 6 | 25.0 |
| Network function | 2007 | 22.0 | 7 | 31.8 |
| Network function | 2008 | 26.9 | 3 | 11.1 |
| Network function | 2009 | 45.7 | 15 | 32.8 |
| Network function | 2010 | 52.4 | 13 | 24.8 |
| Network function | 2011 | 36.2 | 8 | 22.1 |
| Network function | 2012 | 54.9 | 23 | 41.9 |
| Network function | 2013 | 43.1 | 16 | 37.1 |
| Network function | 2014 | 27.6 | 3 | 10.9 |
| Network function | 2015 | 53.4 | 20 | 37.5 |
| Network function | 2016 | 57.0 | 29 | 50.9 |
| Network function | 2017 | 68.4 | 18 | 26.3 |
| Network function | 2018 | 79.5 | 23 | 28.9 |
| Network function | 2019 | 98.2 | 28 | 28.5 |
| Network function | 2020 | 92.2 | 25 | 27.1 |
| Network function | 2021 | 99.4 | 50 | 50.3 |
| Network function | 2022 | 35.2 | 8 | 22.7 |
| Network structure | 1999 | 3.1 | 0 | 0.0 |
| Network structure | 2000 | 3.1 | 0 | 0.0 |
| Network structure | 2001 | 3.1 | 0 | 0.0 |
| Network structure | 2002 | 3.1 | 0 | 0.0 |
| Network structure | 2003 | 3.1 | 0 | 0.0 |
| Network structure | 2004 | 7.1 | 1 | 14.1 |
| Network structure | 2005 | 24.0 | 3 | 12.5 |
| Network structure | 2006 | 34.0 | 7 | 20.6 |
| Network structure | 2007 | 25.6 | 3 | 11.7 |
| Network structure | 2008 | 26.5 | 4 | 15.1 |
| Network structure | 2009 | 28.9 | 9 | 31.2 |
| Network structure | 2010 | 37.8 | 3 | 7.9 |
| Network structure | 2011 | 39.4 | 6 | 15.2 |
| Network structure | 2012 | 40.8 | 7 | 17.1 |
| Network structure | 2013 | 31.2 | 0 | 0.0 |
| Network structure | 2014 | 36.9 | 5 | 13.5 |
| Network structure | 2015 | 41.9 | 5 | 11.9 |
| Network structure | 2016 | 37.0 | 5 | 13.5 |
| Network structure | 2017 | 27.5 | 3 | 10.9 |
| Network structure | 2018 | 35.8 | 7 | 19.5 |
| Network structure | 2019 | 29.5 | 7 | 23.7 |
| Network structure | 2020 | 37.7 | 6 | 15.9 |
| Network structure | 2021 | 28.4 | 6 | 21.1 |
| Network structure | 2022 | 7.1 | 1 | 14.1 |
Read from result.json, run 20261031T060723Z. SHA-256 of the run's file 85c71a54d2d135758e9bba36dcee72af5c1955b93d8c1c4751194942edb34902 and of the published copy 5602861be65526e2ef1007c9ea2222a446b3326a50a38e39871ae98065636384. In the copy, file paths are cut to the file name and the layout (indentation, line endings) may differ; every value is the same.
The preregistered kill text for structure applies. Its pass on the authors' model leans on thin early years: the first five structure years, 1999 to 2003, each hold about 3.1 rebuilt citations and a rate of zero. On five-year windows, function's rate went from 0.253 to 0.377, a ratio of 1.49; structure's first five years are all zero, so its ratio has no finite value.
Total citations also grew. Over the last five years against the five before, function's citations grew 1.86 times and structure's fell to 0.85 times.
With this many focal studies, a true doubling gives an interval clear of 1 only 0.425 of the time, so an interval that includes 1 is no evidence against doubling. The failures of the citation-weighted verdicts show that the data cannot confirm a doubling on that weighting. They do not show that the rise was smaller than double.
Discussion
The reread supports the direction of the original claim and narrows its size. On the authors' own model, "doubled" is a fair description of the fitted curve, and the within-study fits show the rise inside the cited studies, the strongest part of their case. The size depends on a choice of unit. The deposited Count column is a percentage fitted as a count, so each study-year carries equal weight. A year with one citation coded unsupported counts as much as a busy year. Weighted by citations, function rose by about 1.6 to 1.8 times and structure by 1.1 to 1.5 times.
The power figure governs how to read the failures. With 11 and 7 focal studies, even a true doubling usually fails to give an interval clear of 1. The reread therefore does not refute a doubling. It shows that the deposit cannot pin the size down closely on either weighting.
For citing practice we take one rule from this: when a rate is modelled as a count, report the citation-weighted ratio beside it. The sentence we use for the claim is "rose, about doubled on the authors' model", with the interval.
Limitations
- The analysis was not blind. Before the lock we had seen the metadata, the header, one data row and the numerators from an earlier reading; the preregistration lists them.
- Denominators were rebuilt, not read. Years with a rate of zero share a remainder and are the least certain.
- Every rate is the original authors' coding. Their Note 2 calls the coding subjective and names an element of presentism. We did not recode any citation.
- Our definition of doubled may differ from the authors'. Their main figure and article body were not read.
- The calibration measures this pipeline on planted data shaped like the real table. It does not test the coding.
- The intervals are narrower than their stated level. They are 95 percent intervals, and in the planted check they covered a true doubling about 0.89 of the time where 0.95 was claimed. That met the preregistered bar of 0.8. Read every interval on this page as somewhat too narrow.
- Nothing here bears on whether common mycorrhizal networks exist or move resources between trees.
- The literature on the dispute was read at abstract and summary level.
Evidence
Held. Real CC0 data, a calibration that passed and a kill condition fixed in advance, on a question in live dispute. Not blind; the denominators are rebuilt; the coding is the original authors'; power is 0.43 for a true doubling; and the rise inside studies largely supports them.
Figures
These are the paper's own figures, numbered as in the PDF, and each "Figure" reference in the text points here. The charts on this page redraw the same results from the result files and carry their own numbers.
Tables
| Model and group | Ratio | Interval | Shuffle cut | p |
|---|---|---|---|---|
| Authors' model, function | 2.19 | 0.86 to 4.14 | 1.31 | 0.002 |
| Authors' model, structure | 2.84 | 1.18 to 6.62 | 2.09 | 0.013 |
| Authors' model without 2022, function | 2.26 | not reported | ||
| Authors' model without 2022, structure | 2.43 | not reported | ||
| Within study, function | 3.02 | slope 0.022 | 0.001 | |
| Within study, structure | 3.46 | slope 0.036 | 0.009 | |
| Citation-weighted, function | 1.77 | 0.52 to 2.99 | ||
| Citation-weighted, structure | 1.54 | 0.85 to 5.81 |
| Quantity | Forecast | Outcome |
|---|---|---|
| Recovered means within 0.5 points | yes | 0.96 and 0.50 on row means |
| Whole-number share of nonzero rates | 0.75 | 0.846 |
| Authors' model, function | 2.2, passes | 2.19, fails on its interval |
| Authors' model, structure | 2.0, fails | 2.84, passes |
| Without 2022 | lower by 0.2 | 2.26 and 2.43 |
| Within study, function | p about 0.02, passes | p 0.001, passes |
| Within study, structure | p about 0.10, fails | p 0.009, passes |
| Citation-weighted | 1.6 and 1.5 | 1.77 and 1.54 |
| Growth in citations | 1.5 | 1.86 and 0.85 |
| Flat truth called a rise | 0.08 | 0.092 |
Appendix A. The preregistered verdicts
Each verdict is a set of rules written before the run. A verdict passes only when every rule holds. Values are read from the run's result file.
| Verdict | Deciding rule | Value | Holds |
|---|---|---|---|
| Integrity | Count equals 100 times rate in at least 0.99 of rows; at least 11 and 7 studies | 1.0; 11; 7 | yes |
| Means | gap to stated means at most 1.5 points, function and structure | 0.96; 0.50 | yes |
| Rebuild | whole-number share at least 0.7; median gap at most 0.2 | 0.846; 0 | yes |
| Calibration | flat truth called a rise at most 0.15; doubled median 1.6 to 2.4; coverage at least 0.8 | 0.092; 2.11; 0.89 | yes |
| Doubled, function | interval low end above 1 and at most 2; high end at least 2; ratio above shuffle cut (1.31) | 0.86; 4.14; 2.19 | no |
| Doubled, structure | the same rules; shuffle cut 2.09 | 1.18; 6.62; 2.84 | yes |
| Within study, function | slope above 0 and above shuffle cut (0.022) | 0.044 | yes |
| Within study, structure | slope above 0 and above shuffle cut (0.036) | 0.054 | yes |
| Weighted, function | interval low end above 1 and at most 2; high end at least 2 | 0.52; 2.99 | no |
| Weighted, structure | the same rules | 0.85; 5.81 | no |
Appendix B. Rebuilt totals by focal study
Totals over all years for each focal study: the citations the authors reviewed; the rebuilt citations in years with a nonzero rate, where a numerator sets the count (the remainder was spread over the zero-rate years); the sum of rebuilt unsupported citations; and the unsupported total in the paper's table. Derived values only.
| Focal study | Reviewed | In nonzero years | Rebuilt unsupported | Table unsupported |
|---|---|---|---|---|
| Beiler 2010 | 83 | 48 | 14 | 14 |
| Booth 2004 | 73 | 50 | 16 | 16 |
| Booth 2010 | 52 | 39 | 17 | 19 |
| Corrales 2016 | 75 | 28 | 5 | 5 |
| Diedhiou 2010 | 41 | 8 | 3 | 3 |
| Grelet 2010 | 56 | 29 | 5 | 5 |
| Horton 1999 | 142 | 114 | 24 | 24 |
| Horton 2005 | 49 | 23 | 11 | 10 |
| Kennedy 2003 | 120 | 106 | 26 | 25 |
| Klein 2016 | 91 | 90 | 27 | 27 |
| Lerat 2002 | 49 | 45 | 25 | 25 |
| Lian 2006 | 102 | 18 | 5 | 6 |
| McGuire 2007 | 118 | 96 | 25 | 25 |
| Simard 1997 | 382 | 345 | 118 | 116 |
| Teste 2008 | 58 | 53 | 26 | 26 |
| Teste 2009 | 80 | 68 | 27 | 28 |
| Teste 2010 | 40 | 33 | 20 | 21 |
| Warren 2008 | 65 | 49 | 24 | 25 |
Numbers recorded in our publication register
| What | Value |
|---|---|
| Sample | 268 study-year rates, 11 function and 7 structure studies, 4 blank rows skipped |
| Main estimate and interval | authors' count model 0.86 to 4.14 (function) and 1.18 to 6.62 (structure); citation-weighted 0.52 to 2.99 and 0.85 to 5.81 |
| Forecast against outcome | count model, function: forecast 2.2, got 2.19; structure: forecast 2.0, got 2.84; the within-study rise for structure was forecast to fail and passed at p 0.009 |
| Known-answer check | planted flat and doubled truths; rebuilt totals against the paper's table totals, median gap 0 |
As recorded in the publication register, the summary row each finding gets; the paper's own numbers above were re-read from the result files.
What lowers it
- blinding Not blind. The analyst saw the metadata, one row and the numerators from an earlier reading of ours before the lock; the paper lists this. from our publication register, on blinding
- depth of reading The cited literature was read at the level of abstracts, search summaries and publisher pages; full texts were not read. from the Verified section
What holds it up
- scoring Scored by code against rules fixed in advance. from our publication register, on who scored it
- preregistration Preregistered and hash-locked before the run (sha256 55a37426). from the Reproduce section
- control Controls: the calibration on planted data worked (a flat truth called a rise 0.09 of the time, a doubled truth read at a median of 2.11, coverage 0.89); the shuffles worked; the rebuild of the denominators passed its check. from our publication register, on controls
- open data Public data. from our publication register, on the data licence
Where the claim stands
- lead
- hypothesis
- thesis
- conjecture
- theorem
- law candidate
- killed
A preregistration with pass-or-fail rules is on file, which this rung needs. The next rung needs a named rival reading beaten by a decisive observation, and none is on file. Tier B*: Real CC0 data, a calibration that passed and a kill condition fixed in advance, on a question in live dispute. Not blind; the denominators are rebuilt; the coding is the original authors'; power is 0.43 for a true doubling; and the rise inside studies largely supports them.
Trail
Versions
- v3 2026-11-14, this page corrected, 2 items; the PDF and its BuildTeX source are still paper version 1.0
- v2 2026-11-09, paper version 1.0, first published PDF sha256 44c892b8578ac367
- v1 2026-10-31, entered in the findings ledger
Corrections
2026-11-14 scope found by a check after publication
A review found that the page reported interval coverage of 0.89 as a pass and left out what it means for the intervals. now The calibration met its preregistered bar of 0.8. The intervals are 95 percent intervals and covered a planted doubling about 0.89 of the time, so they are narrower than their stated level. The results, the limitations and charts 1 and 5 now say so. No result changed.
2026-11-14 wording found by a review of the published pages
A review of the published page found one sentence that claimed more than was checked. now The abstract said doubled fairly describes the authors' fitted curve; their curve was not available, and the page refits their model from the deposited table, so the sentence now says that.
2026-10-31 wording found by the study itself, before publication
The first run stopped on rows with an empty rate cell. now Such rows are now skipped and counted. The preregistration and plan were unchanged; the code hash changed.
Each correction is a dated note; the findings ledger is never rewritten, and a note governs where it differs.
Ledger and version dates up to publication are local dates in US Pacific time. Clock times in the text are UTC, seven or eight hours ahead, so a lock or a run stamped just after midnight UTC belongs to the previous local day. Corrections from 14 November 2026 on are dated in UTC.
References
- Karst, J., Jones, M. D. and Hoeksema, J. D. (2023). Positive citation bias and overinterpreted results lead to misinformation on common mycorrhizal networks in forests. Nature Ecology and Evolution 7, 501-511. doi:10.1038/s41559-023-01986-1 abstract or summary, 2026-11-09: abstracts, search summaries and publisher pages; full text not read used in Introduction and motivation
- Karst, J., Jones, M. D. and Hoeksema, J. D. (2023). Author Correction: Positive citation bias and overinterpreted results lead to misinformation on common mycorrhizal networks in forests. Nature Ecology and Evolution 7, 623. doi:10.1038/s41559-023-02035-7 abstract or summary, 2026-11-09: abstracts, search summaries and publisher pages; full text not read used in Introduction and motivation
- Karst, J., Jones, M. D. and Hoeksema, J. D. Deposited rate table (Data_submit.tab) and metadata accompanying Karst et al. (2023). Dataverse, CC0. doi:10.5683/SP3/88MZYX run here Licence: Dataverse table CC0; Note 3 numerators from a copyrighted supplement, derived values only used in Data and provenance
- Klein, T., Rog, I., Livne-Luzon, S., van der Heijden, M. G. A. and Körner, C. (2023). Belowground carbon transfer across mycorrhizal networks among trees: facts, not fantasy. Open Research Europe 3, 168. doi:10.12688/openreseurope.16594.1 abstract or summary, 2026-11-09: abstracts, search summaries and publisher pages; full text not read used in Introduction and motivation
- Simard, S. W., Ryan, T. S. L. and Perry, D. A. (2025). Opinion: Response to questions about common mycorrhizal networks. Frontiers in Forests and Global Change 7, 1512518. doi:10.3389/ffgc.2024.1512518 abstract or summary, 2026-11-09: abstracts, search summaries and publisher pages; full text not read used in Introduction and motivation
Cited by later findings
- No later record in the findings ledger treats this finding.
Reproduce
Data
- Karst, J., Jones, M. Licence: Dataverse table CC0; Note 3 numerators from a copyrighted supplement, derived values only. https://doi.org/10.5683/SP3/88MZYX
Preregistration
sha256 55a3742673c0367dccf6c7ef22ead2435aae431199a620e13753f5df5924294e
plan 7ffc684f107f7ca0963792dcabe7f1d9005158cae6ad78cfef9636fbf1fe6309
Steps
- Data: the CC0 rate table from the Dataverse deposit for Karst, Jones and Hoeksema (2023), and the per-year numerators in the paper's supplementary Note 3.
- Rebuild each study-year's citation count as the whole number with rate ; spread the remainder of each study's reviewed total over its zero-rate years; check that rebuilt numerators match the table totals.
- Fit eq. 1 to the percentages and report eq. 2; fit eq. 3 by quasi-Poisson; fit eq. 4 to the rebuilt counts and report eq. 5. Resample focal studies for intervals.
- Shuffle rates across years inside each study 1,000 times for the controls. Calibrate with planted flat and doubled truths of the same shape.
- Preregistration SHA-256: 55a3742673c0367dccf6c7ef22ead2435aae431199a620e13753f5df5924294e. Plan SHA-256: 7ffc684f107f7ca0963792dcabe7f1d9005158cae6ad78cfef9636fbf1fe6309. Run 20261031T060723Z. Result file SHA-256: 85c71a54d2d135758e9bba36dcee72af5c1955b93d8c1c4751194942edb34902.
Cost. The analysis took 237 seconds on one desktop computer. The study was not re-run for this paper.
Downloads
- Whitepaper, PDF F149.pdf, 536 KB
- BuildTeX source F149.bld, 33 KB
- Build receipt F149.buildtex.json, 1 KB
- BuildLang doc module doc.bld, 5 KB, imported by the source
The PDF is typeset by BuildTeX from F149.bld, which is written from the same source as this page. The receipt records the source's SHA-256 and the PDF's (44c892b8578a), so anyone can rebuild it and compare. The copy here has its hidden author field blanked, as the site does for every file it publishes; blank the same field in a rebuild before comparing. The name stays on the first page.
Verified
Verified on 2026-11-09. On 9 November 2026 the 268 rates and 4 skipped rows, the group row counts, study counts and spans, the rebuild counts (143 whole-number, 26 fraction-only, 99 zero-rate years), the 0.846 whole-number share and zero median gap, the per-study totals, the recovered means, the calibration rates including the 0.425 power figure, every ratio with its interval, shuffled percentile and p value, the ratios without 2022, the within-study slopes and ratios, the fitted shares, the pooled and five-year windows, the citation growth figures and all ten verdicts were re-read from the run's result file; they match the findings ledger. The preregistration and result files match their recorded SHA-256 hashes. Both figures were drawn by a script that reads only the result file.
Not checked. The study was not re-run for this paper. The cited papers were found by searches run on 9 November 2026 and read at the level of abstracts, search summaries and publisher pages; the full texts were not read.
Terms on this page
Each term is defined where it is first used on this page. Each name below opens its entry in the findings glossary, which lists every page that uses it.
- common mycorrhizal network forest ecology and mycology first use
- focal study our usage, following Karst and colleagues first use
- unsupported citation citation analysis, as coded by Karst and colleagues first use
- preregistration research method (metascience) first use
- verdict research method (our usage) first use
- kill condition research method (our usage, after Popper's falsification) first use
- study-year rate our usage for the deposited table first use
- rebuilt denominator our usage in this study first use
- negative binomial model statistics (count regression) first use
- within-study model statistics (fixed effects) first use
- quasi-Poisson fit statistics (count regression) first use
- citation-weighted share model statistics (logistic regression) first use
- study resampling statistics (cluster bootstrap) first use
- control statistics and experimental design first use
- p value (from draws) statistics first use
- planted check research method; called a positive control in experimental science first use
- statistical power statistics first use
To report an error, name the finding, the claim number and the source on the Work page, which gives the address. Accepted corrections join the Trail with their date.