Atlas essay · education and access
Availability Is Not Reach
This essay asks how the public can tell whether tutoring still works once it becomes a routine budget item. Randomized trials, which assign students by chance to tutoring or to a comparison group, support structured tutoring as a way to help students learn. In June 2025, 85 percent of U.S. public schools said they offered some tutoring. In October 2024, a separate survey month, public schools reported on average that 8 percent of their students received high-dosage tutoring, the intensive kind, and these national survey estimates do not link current participation to learning outcomes. A program that grows large can keep the label "evidence-based" only while the public can still see whom it reached, what students received, what changed, and what remains uncertain, and the essay proposes a short public record that would show those facts.

In this article
Research summary and limits
Question. What would count as public proof that high-dosage tutoring still works after tutoring paid for with federal COVID-19 emergency relief money becomes an ordinary budget decision?
Finding. Randomized trials support structured tutoring. Estimates matched to large programs run smaller, and national availability is much broader than measured student reach.
Evidence. Two meta-analyses, which pool many trials into one average, and current federal survey data separate experimental effects, school offers, student participation, implementation, and funding conditions.
Limit. The national estimates come from different months and denominators, and none links current participation to student learning outcomes.
A proven intervention enters ordinary budgets
Tutoring has one of the stronger records among education interventions in randomized experiments, studies that assign students by chance to tutoring or to a comparison group. That record matters, and once tutoring paid for with federal COVID-19 emergency relief money becomes a recurring system, the public question moves from whether tutoring works in studies to whether this program delivers it. An average drawn from past studies cannot show whether a school today found tutors, scheduled sessions, reached eligible students, or delivered the intended time.
So the program has to be measured where students meet it. Administrative records show narrower facts: an appropriation shows that money was authorized, a contract that capacity was purchased, and an enrollment list that students were assigned. None of those records alone shows what instruction arrived or what outcome changed.
What "works" means in the trials
A systematic review published online in 2023, and in a journal issue in 2024, pooled 89 randomized tutoring studies. It reported an overall pooled effect of 0.288 standard deviations, with a standard error of 0.029 and p<0.001. A review of this kind, called a meta-analysis, combines many studies into one average. A standard deviation measures the usual spread of student scores around their average, so 0.288 is a little more than a quarter of that spread. Standard deviations work as a shared unit, so results from different tests can be compared on one scale. Putting the studies on one scale still leaves them as different programs.
The studies varied in grade, subject, tutor role, schedule, setting, assessment, and era. The pooled estimate is evidence that structured tutoring can improve learning under tested conditions. An activity that goes by the name tutoring can still fall short of that average.
Larger programs call for more modest claims
A 2026 meta-analysis examined 263 randomized controlled trials. It asked what happens when the evidence is matched to large programs and to independent standardized tests. Its full sample produced a pooled estimate of 0.40 standard deviations. The target-aligned estimates, the ones matched to those conditions, averaged 0.22 for programs serving 400 to 999 students and 0.16 for programs serving at least 1,000 students.
Each of those estimates comes from a different group of studies, so the three numbers describe separate samples. The largest-program estimate is imprecise because relatively few trials met the condition, and the authors report wide prediction intervals. A prediction interval is the range where the effect of a new, comparable trial would likely fall. The pattern does not establish a fixed penalty for crossing a particular enrollment threshold.
Larger programs often change several things at once. Intended dosage, meaning how much tutoring time each student is meant to get, can shift along with the number of students per tutor, targeting, delivery setting, and implementation quality, meaning how well the program runs as planned. The analysis examines those changes, and it cannot single out program size as one cause. A smaller target-aligned average can still matter for learning. It also calls for more modest public claims.
Availability is not reach
The National Center for Education Statistics reports that in June 2025, 85 percent of public schools offered some tutoring. Forty-two percent offered high-dosage tutoring, the intensive kind as the survey defines it. The 85 percent figure comes from the survey's estimate that 15 percent of schools offered no tutoring. Both figures describe schools, and both are weighted so the surveyed schools stand for public schools nationwide.
The latest student-reach figures from the same survey come from October 2024. Across all public schools, the average share of students in high-dosage tutoring was 8 percent, and within schools that offered it the average share was 25 percent. These are student-participation estimates summarized at the school level.
The four percentages must not become a funnel, the kind of chart that shows one group shrinking step by step. June 2025 availability and October 2024 reach come from different months and answer different questions. They share no sequential denominator, one base number that each step is taken from. Read together, the four numbers mark a gap in measurement, because none of them tracks one group of students through the whole process. An attrition rate would give the share of students lost at each step, and these figures cannot supply one.
Measure what students received
A minimum public receipt, a short record of what a program delivered, would keep each fact in its own field. Who could get tutoring and who came: intended eligibility, unique students served, assigned sessions, and attended sessions. How much students received: minutes delivered, weeks active, group size, and continuity. The tutors' role, training, and supervision would each get a field, as would the subject and grade. The receipt would also name the outcome and the baseline, the score before tutoring began. It would give the follow-up interval, the time until the outcome is measured again, and the missing-data rule, which says how students without a final score are counted. Last comes the cost denominator, what the cost is divided by, such as each student served or each hour delivered.
This list is an editorial accountability design, a proposal made in this essay. It is not a federal standard, and it makes no claim that disclosure alone improves instruction. Its purpose is narrow: to keep a program offer, a seat, an attendance record, and a completed dosage from passing as the same fact.
Show the denominator
A statement such as "90 percent attended" is incomplete until the reader can see the denominator. It could mean that 90 of 100 enrolled students attended once. It could also mean that 90 percent of eligible students enrolled, or that 90 percent of assigned sessions were completed. Each reading answers a different question.
Take an illustrative program with 120 eligible students and 80 assigned seats. Seventy-two students attend at least once, and 48 complete the intended dosage. The 48 completers are 40 percent of eligible students and about 67 percent of the students who attended. The numbers are invented to show why the denominator belongs in the claim. They describe no real school, district, or program.
Keep an independent outcome
Session completion measures implementation, meaning whether the program ran as planned. Learning needs a measure of its own. Tutor-made checks, program dashboards, district assessments, and independent standardized tests can all carry useful information. They support different claims and face different incentives, since a program that scores its own results has a stake in how they come out.
An outcome should be named before the result, matched to the question, and reported with its missing-data rule and its interval, the range the true result likely falls in. Standardized tests are not the only measures that can count as independent. In this essay, a measure is independent when neither it nor its analysis quietly changes after the implementation result is known.
Funding can show only whether tutoring may continue
Federal guidance identifies recurring programs that may support eligible tutoring costs. Some are formula programs, which share out money by a set formula, and some are discretionary grants, which are awarded by application. They include federal title programs, named for the titles of the main federal school-funding law, and other grants. Eligibility, allowable uses, state plans, and local appropriations still govern any specific use. So do supplement-not-supplant requirements, which say federal money must add to state and local spending and may not replace it.
Liquidation extensions give recipients more time to make final payments on emergency relief money they had already committed. The Department of Education's current page on those extensions records a March 2025 policy change and later court injunctions. According to the Department's own updates on that page, previously approved extensions continued while the litigation went on. That status can change, and it does not describe every recipient.
Funding evidence speaks only to whether continuation may be possible. How many students received tutoring, what dosage arrived, and whether learning changed have to come from delivery and outcome records.
The public claim
A public system should be able to say what it offered, whom it intended to serve, whom it reached, what students received, what outcome it measured, what changed, and what the evidence does not establish. Each of those answers needs its own denominator, date, and limitation.
"Evidence-based" describes a bounded claim, one tied to a particular design and a particular outcome: this kind of tutoring, delivered this way, improved this measured outcome. The label does not carry over automatically from a research literature to every program that puts the research into practice. If delivery and outcomes disappear from public view as a program grows, the evidence describes past studies and no longer supports a current public claim about that program.
Figure 1. Availability is not reach
Panel A shows the percent of U.S. public schools that offered tutoring in June 2025. Panel B shows the average percent of each school's students in high-dosage tutoring in October 2024, a different month with a different base number, so each panel answers its own question.
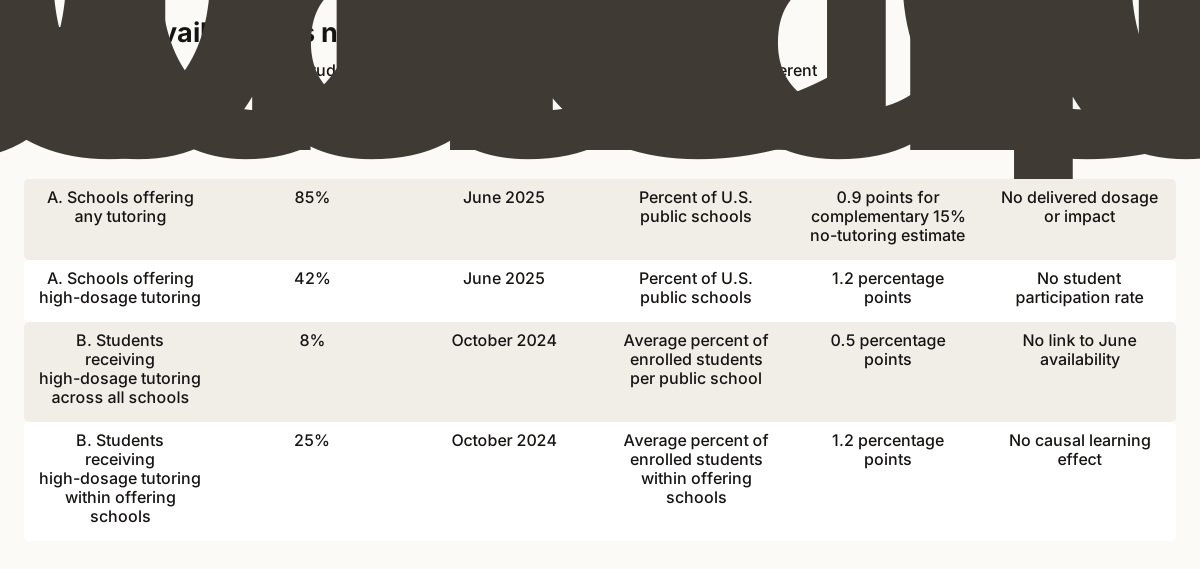
What this cannot show. The four values are not a sequential funnel, an attrition rate, or evidence that current tutoring caused achievement changes.
Read the data and method
| Panel and measure | Estimate | Date | Unit and base number | Margin (standard error) | What it does not show |
|---|---|---|---|---|---|
| A. Schools offering any tutoring | 85% | June 2025 | Percent of U.S. public schools | 0.9 points, for the 15% offering no tutoring | No delivered dosage or impact |
| A. Schools offering high-dosage tutoring | 42% | June 2025 | Percent of U.S. public schools | 1.2 percentage points | No student participation rate |
| B. Students receiving high-dosage tutoring across all schools | 8% | October 2024 | Average percent of enrolled students per public school | 0.5 percentage points | No link to June availability |
| B. Students receiving high-dosage tutoring within offering schools | 25% | October 2024 | Average percent of enrolled students within offering schools | 1.2 percentage points | No causal learning effect |
- Does not prove
- The four values are not a sequential funnel, an attrition rate, or evidence that current tutoring caused achievement changes.
- Scope
- School Pulse Panel estimates for U.S. public schools in two separate survey months
- Units
- Percent and percentage-point standard error
- Denominator
- Panel A uses public schools; Panel B uses average enrolled-student shares across all schools or offering schools
- Date
- June 2025 availability; October 2024 reach; source checked 1 September 2026
- Transformation
- The 85 percent estimate is the published complement of 15 percent no tutoring; no confidence intervals or cross-panel rates are computed
- Uncertainty
- School-reported weighted survey estimates from different months with different denominators
- Limitations
- The panels are descriptive, not linked to student outcomes, and draw no arrows between measures.
Sources
- School Pulse Panel tutoring results and official data workbook. National Center for Education Statistics. Current federal survey release and primary aggregate data workbook. Published 2025-06-01; observed 2026-09-01.
- School Pulse Panel methodology. National Center for Education Statistics. Official sampling, collection, weighting, and disclosure methodology. Published 2024-07-01; observed 2026-09-01.
- The Promise of Tutoring for PreK-12 Learning: A Systematic Review and Meta-Analysis of the Experimental Evidence. American Educational Research Journal. Peer-reviewed systematic review and meta-analysis of randomized tutoring evaluations. Published 2023-11-27; observed 2026-09-01.
- What Impacts Should We Expect From Tutoring at Scale? Exploring Meta-Analytic Generalizability. Review of Educational Research. Peer-reviewed scale-focused meta-analysis of randomized controlled trials. Published 2026-06-05; observed 2026-09-01.
- Sustaining Evidence-Based High-Dosage Tutoring. U.S. Department of Education. Official implementation and recurring-funding guidance. Published 2024-06-01; observed 2026-09-01.
- Education Stabilization Fund Liquidation Extensions. U.S. Department of Education. Official current boundary on emergency-relief liquidation status. Published 2025-10-06; observed 2026-09-01.
Claim notes and limitations
One broad meta-analysis of randomized tutoring evaluations reported an overall pooled effect of 0.288 standard deviations.
Sources: S3
- Scope
- Eighty-nine randomized PreK-12 tutoring studies synthesized across varied programs and outcomes
- Uncertainty
- Programs, populations, subjects, assessments, settings, and eras varied
- Does not prove
- That any current local tutoring offer will reproduce the pooled effect
Scale-relevant tutoring estimates were smaller than the full-sample average in the 2026 analysis.
Sources: S4
- Scope
- Two hundred sixty-three randomized controlled trials with target-aligned independent-test subsets
- Uncertainty
- Few very large trials and wide prediction intervals
- Does not prove
- A fixed penalty for crossing a particular enrollment threshold or one causal mechanism
In June 2025, 85 percent of public schools reported some tutoring and 42 percent reported high-dosage tutoring.
Sources: S1
- Scope
- Weighted school-level School Pulse Panel estimates for U.S. public schools
- Uncertainty
- School-reported survey estimates; 85 percent is the complement of 15 percent no tutoring
- Does not prove
- Student reach, delivered dosage, implementation fidelity, or learning impact
In October 2024, average high-dosage participation was 8 percent across all public schools and 25 percent within schools offering it.
Sources: S1
- Scope
- Student-participation estimates summarized at the school level
- Uncertainty
- A different month and denominator from the June 2025 availability estimates
- Does not prove
- A sequential funnel from 85 to 42 to 25 to 8
School Pulse Panel estimates describe reported availability and reach. They are not linked to student-level learning outcomes.
- Scope
- A monthly web survey of a sampled and weighted panel of public schools
- Uncertainty
- Weighting adjusts for sampling and nonresponse. It does not verify implementation
- Does not prove
- Causal effectiveness of current tutoring programs
Recurring federal streams may support eligible tutoring costs while emergency-fund liquidation status remains legally and administratively qualified.
- Scope
- Federal guidance and the Department's current liquidation-extension page
- Uncertainty
- Local eligibility, appropriations, state plans, and litigation vary and can change
- Does not prove
- A universal funding cliff, available local funds, or a funded local program
Public accountability should preserve availability, eligibility, reach, delivered dosage, staffing, cost, and independent outcomes as separate fields.
Sources: S1, S2, S3, S4, S5, S6
- Scope
- An editorial synthesis connecting experimental evidence, implementation conditions, survey measures, and funding boundaries
- Uncertainty
- The proposed receipt is not a validated reporting standard
- Does not prove
- That disclosure alone improves tutoring delivery or outcomes
"Evidence-based" is a bounded claim tied to a design and an outcome, and it does not carry over automatically to every program that grows large.
- Scope
- Editorial interpretation of experimental generalizability and implementation boundaries
- Uncertainty
- The claim does not evaluate any named school, district, tutor, or provider
- Does not prove
- A verdict on any specific current tutoring program
Corrections
No corrections recorded.